AI Ethnicity Analyzer: Four Instruments, One Name
An analyzer implies parts, but four quite different machines trade under that name: a label classifier, a geometry tool, an embedding search and a genomic panel. Each fails somewhere else.
What the word analyzer promises
Calling something an analyzer promises decomposition: a device that takes a thing apart and reports the parts. Four distinct machines currently trade under that name, and only two of them take anything apart. A face attribute classifier returns a label drawn from a fixed list. An embedding system returns a coordinate, and the analysis is a distance to stored points. A landmark system returns millimetres between points on a mesh, which is the only literal analysis in the group. A genomic panel returns proportions against a reference set. Two report parts and two report a verdict dressed as a report.
The distinction is practical rather than academic. If a tool reports a label, the ceiling on its accuracy is set by the label list behind it. If it reports measurements, the ceiling is set by pose, lens and alignment. If it reports a distance, the ceiling is set by whatever was stored. If it reports proportions, the ceiling is set by the reference panel. Every one of those four ceilings can be located in a product's own documentation, which is a faster route to judgement than any headline accuracy figure.
Instrument one, the attribute classifier
An attribute classifier assigns a category. A large training collection gets labelled by hand, a network learns the mapping, and inference returns one entry from that taxonomy. This is the design behind FairFace, a face attribute dataset assembled by Kimmo Karkkainen and Jungseock Joo and presented at WACV in 2021. It contains 108,501 images spread across seven groups, built specifically because earlier public face collections skewed toward a single group and left others underrepresented. The paper's own framing is the interesting part: balancing the training data improved accuracy on new data and made that accuracy more consistent across groups.
That framing exists because the unbalanced version had already been documented. In Gender Shades, presented in 2018 by Joy Buolamwini and Timnit Gebru, three commercial gender classifiers were tested against a set of 1,270 images. Error rates for darker-skinned women reached 34.7 percent on one system, while the maximum error rate for lighter-skinned men was 0.8 percent. The authors traced the gap to the benchmarks used to measure those systems: the IJB-A set was 79.6 percent lighter-skinned subjects. A labelled taxonomy is only as reliable as the examples sitting behind each label.
Instrument two, the landmark analyzer
The second instrument is the one that deserves the word analysis. Landmark detectors locate a fixed set of points on a face, and 68 points is the convention inherited from the annotation scheme used to train them. Those points supply distances and angles, so the output is geometry: ratios of face length to width, nose breadth, the vertical position of the eye line. Statistical shape models go further and treat the whole surface as a weighted sum of exemplar meshes, an approach established by Volker Blanz and Thomas Vetter in 1999 and extended to a model learned from 10,000 scanned faces by James Booth and colleagues in 2016.
The failure profile here is multiplicative rather than categorical. A four percent error in landmark placement becomes a four percent error in every ratio derived from those points, and head pose compounds it, because the same set of points projected from a turned head and from a frontal one does not yield the same distances. Measurement standards therefore fix capture geometry before anything else. A geometry instrument is the most transparent of the four and the most sensitive to how the photograph was taken.
Instrument three, the embedding analyzer
The third machine never names a category or a millimetre. It maps a face to a vector, and everything downstream is arithmetic on vectors. FaceNet, published by Florian Schroff, Dmitry Kalenichenko and James Philbin at CVPR in 2015, learned a 128-dimensional embedding in which Euclidean distance corresponds to facial similarity, reaching 99.63 percent on the Labeled Faces in the Wild benchmark. Later margin-based losses, ArcFace among them, reshaped the same idea by pushing separate classes further apart inside that embedding space.
Users meet this design whenever a tool reports that a face resembles a reference image, or finds the closest stored pattern. The output is a ranking, and a ranking is only as meaningful as the pool it ranks against. Nearest neighbour among forty stored averages is a statement about those forty. It is also the stage where an ancestry claim is most easily smuggled in, because a short distance to a stored point looks like evidence of origin when it is really evidence of stored points.
Instrument four, the genomic analyzer
The fourth instrument does not read the photograph at all, and it is the only one whose input has a direct physical relationship to descent. Panels of ancestry-informative markers are chosen because their allele frequencies differ markedly between population samples. The Kidd laboratory panel at Yale uses 55 such single nucleotide polymorphisms and resolves up to ten biogeographic groupings, with allele frequencies for 164 population samples published through the laboratory's browser. The output is a likelihood ranking of reference populations, and the panel's own literature notes that the number of statistically relevant groupings a panel can support is a property of the panel, not of the person.
Two consequences follow for anyone comparing analyzers. First, this instrument answers a question about descent, and a photograph does not contain descent. Second, its resolution is a deliberate design choice: 55 markers support ten coarse groupings, and separating populations inside one of those groupings requires a second-tier panel of additional markers. An analyzer that borrows the authority of genetics should be asked which panel it used.
Three axes that separate them
Set side by side, the four instruments separate cleanly along three axes, and that separation explains most disagreements between their advertised results. The first axis is input: a photograph, an aligned set of measured points, or a genotype profile. The second is output type: a label, a distance, or a proportion. The third, and the one most often left out of marketing, is what the error attaches to, since a categorical error belongs to a class, a measurement error belongs to a pose, and a proportional error belongs to a reference panel.
- Input: one photograph, an aligned set of landmarks, or a genotype profile.
- Output: a label from a list, a distance to stored faces, or proportions across a reference set.
- Error: attached to the rarest training class, to head pose, or to the composition of the reference panel.
Why the label list ages first
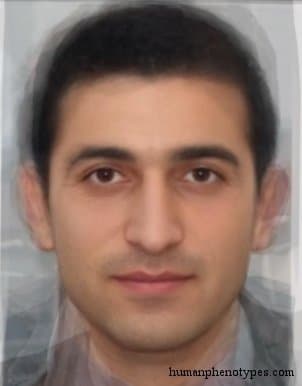
Every one of these instruments depends on a fixed list of units, and the catalogue this site publishes shows how long such a list can survive. Its entries are named for physical and historical regions rather than for states: Armenid for the highlands of Asia Minor, Karnatid for the South Indian plateau, Pre Nilotid for the Nile borderlands between Sudan and Ethiopia, Central Pamirid for the high mountain valleys of the Pamirs. Those names came out of a historical literature that described distributions around 1,500 years ago, and they have outlasted most of the political geography drawn around them.
A machine learning label list enjoys no such durability, because it is whatever an annotation team was handed, and annotation teams work with the category schemes of their own moment. Add admixture and internal migration, and the units a classifier was trained on describe a population that no longer lines up with the photographs now submitted to it. The practical test for any analyzer is therefore unglamorous: ask which list it outputs, when that list was fixed, and what share of its training examples sit in the classes you actually care about.
Frequently Asked Questions
- Is an AI ethnicity analyzer the same thing as a genomic ancestry panel?
- No. They accept different inputs and report different quantities. A photo-based analyzer works from pixels, so its output is a label, a distance or a geometric measurement derived from an image. A genomic panel works from a genotype profile and reports likelihoods across reference populations. The two can agree by coincidence for some individuals, but they are not measuring the same thing, and a photograph carries no information about which markers a person has. Treating one as a substitute for the other is a category error before it is an accuracy question.
- Why do two different AI analyzers give me different answers for the same photo?
- Because the label lists, the training data and the decision thresholds differ. A classifier trained on seven broad groups cannot return a finer answer than those seven. An embedding system may report only the closest stored reference face. A landmark system reports geometry with no category attached. Image handling adds further variance, since crop, head pose and illumination change measurements before any model runs. Agreement between two tools is not confirmation, and disagreement is not proof that one of them is broken.
- Which of the four instruments should I trust more?
- Trust is the wrong frame, because the four answer different questions and each is dependable inside its own limits. A landmark system is reliable when capture geometry is controlled, and meaningless when it is not. A classifier is dependable for the classes it saw often in training. An embedding search is dependable as a similarity ranking and misleading as an ancestry claim. A genomic panel is dependable about descent and silent about everything else. Match the instrument to the question you actually have.
Related Phenotypes
Faces from the encyclopedia that appear in this article. Open any entry for its full description, distribution, and references.
Armenid
Caucasus
Widespread type, found in its most specialised form in the mountains of Asia Minor. Associated with the ancient Cypriots and the Hittite Kin...
Karnatid
Southeast Asia
South Indian type, found in its purest form in Tamil Nadu and Northern Sri Lanka, called Melanid according to its dark skin tone (melanin). ...
Pre Nilotid
East Africa
Ancient type with Proto Nilotid traits, today still found in the border region of Sudan and Ethiopia. Common in Kwama, Uduk, Gumuz, Mao, and...
Central Pamirid
Central Asia
The most typical Pamirid variety, also called Mountain Pamirid. Often considered the most typical Turanid. Most common in highland Tajiks, w...
Test what you learned
Put your eye for regional faces to work in the daily quiz — a composite face, a world map, and your best guess.