Ethnicity Estimate vs DNA Test: One Is a Product of the Other
A DNA test produces one file; the ethnicity estimate is a report computed from that file, and the percentage moves when the reference panel moves.
The report is not the test
A consumer DNA test does one thing: it reads a fixed set of positions in a genome. The array most services have used since the mid-2010s genotypes roughly 630,000 single-letter sites, about 0.02% of the 3.1 billion base pairs a person carries. Everything else in the report, the ethnicity estimate included, is arithmetic performed on that file. The distinction sounds pedantic until you notice that the file stays fixed while the estimate does not.
That is why the search phrase sets a product against the instrument that makes it. A genotype is a lab measurement with a stable output. An ethnicity estimate is an interpretation with a version number, and the interpretation is where the disagreement lives. The measurement can be carried between services, because a file of genotypes is portable. The interpretation cannot, because each service reads the same letters through a different set of reference samples.
How a percentage gets assembled
Two pieces of machinery produce the number. The first is clustering. STRUCTURE, published by Pritchard, Stephens and Donnelly in Genetics in 2000, and ADMIXTURE, published by Alexander, Novembre and Lange in Genome Research in 2009, both fit a model in which each person's genome is a mixture of K ancestral components. K is not discovered by the data; an analyst sets it. Rosenberg and colleagues ran 377 microsatellites from 1,056 people in 2002 and found that K=5 recovered clusters close to continents, then noted in the same paper that only 3 to 5% of human variation separates those clusters, against the 85% Lewontin had measured within populations in 1972.
The second is chromosome painting. RFMix, described by Maples and colleagues in the American Journal of Human Genetics in 2013, walks along each chromosome and copies stretches from whichever reference haplotype fits best, so the output is a set of segments rather than a single percentage. Segment length carries a date. A tract inherited for t generations averages about 1/t Morgans, and one Morgan is roughly 100 centimorgans, the distance over which a 1% chance of recombination occurs per generation. A ten-centimorgan block therefore points to about ten generations, or 250 to 300 years. Long blocks are recent, short blocks are old, and below a couple of centimorgans the signal sinks into noise.
The reference panel decides the answer
Every label a service returns has to exist in its reference panel first. The 1000 Genomes Project's phase 3 release carried 2,504 individuals drawn from 26 populations, and the Human Genome Diversity Panel covers 51 populations. Those are small numbers for a planet, and the donors were sampled at particular places in particular decades. A region name in a report is a curated set of people with a boundary drawn around them, and a population absent from the panel gets absorbed into whichever cluster sits nearest.
This is a structural limit rather than a failure of one company, and it comes with an unusual virtue: the panels are published. A reader can look up which 26 populations sit behind a result and judge how coarse the grid is. That kind of audit is not usually available for a model trained on photographs, where the training set is a trade secret and the labels were assigned by whoever assembled the dataset.
Updates move the number without new DNA
Vendors revise their panels, and when they do, every stored genotype is re-read against the new one. A person who uploaded a file in 2019 and again in 2024 can receive different percentages from an identical genotype, because the denominator changed rather than the person. Reports handle this by printing confidence ranges: a figure given at 90% confidence is narrower than the same figure at 50%, and the spread is often wide enough to overlap a neighbouring region entirely.
The consequence is that an ethnicity estimate is a document with a date on it, in the way a map is. Two editions can both be correct for the panel each was drawn against. Anyone comparing a 2018 screenshot with a 2025 one is comparing two editions of an interpretation, not catching an error in a measurement. The file that produced both is byte-identical, which is the cleanest demonstration that the percentage belongs to the panel rather than to the person.
What a catalogue entry returns instead
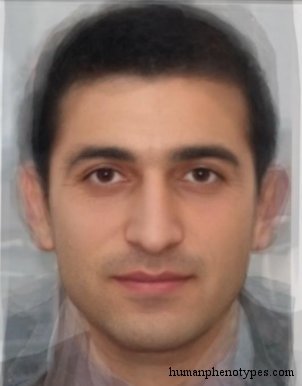
The entries on this site answer a different question with a different kind of object. Take Armenid, named for the Armenian highlands: the entry places its most specialised form in the mountains of Asia Minor, ties it to Hittite-period Anatolia and to Bronze Age Cyprus, and describes a hyperbrachycephalic, hypsicranic skull with a long convex nose. East Pamirid is narrower still, recorded among Pamiri speakers around Rushan, Shughnan and Wakhan in the mountains of eastern Tajikistan and northern Afghanistan, and read in the literature as a relict of an Armenoid-like population once spread across western and central Asia.
North Lappid carries a date in its distribution rather than in a statistic. It is associated with Eastern Saami speakers such as Skolt and Inari, runs from Finnmark across northern Finland to the Kola Peninsula, and was still recorded near St. Petersburg around 1700 before receding. Three entries, three place names, no percentages. What each one holds is a described pattern with a documented range at a baseline roughly fifteen hundred years back, which is a claim about a sample and never a claim about a reader.
Where the old map stops matching
Both instruments lose resolution at the same point, which is movement. A panel assembled from mid-twentieth-century donors cannot describe a city that doubled in size twice after 1970, and neither can a catalogue built from literature that assumed people stayed near where they were born. Lagos, Manila, São Paulo and Dubai are the places where a percentage and an entry description both blur fastest, and the blur is less a flaw in either method than a statement about what each was built to measure.
The difference appears in what each returns once resolution fails. A test returns a wider confidence interval and a coarser label, and says so in the report. A catalogue returns nothing, because an entry either has a documented distribution or it does not have one. That asymmetry is worth knowing before either instrument is asked to answer a question about a living person.
Which question each one answers
If the goal is a checkable document about your own genome, with published uncertainty, relative matching and the option to re-read one file after a panel update, a DNA test does that and nothing on this site does. The advantage is real and not small: the file is portable, the method is disclosed, and a second laboratory can in principle reproduce the genotype.
If the goal is to understand what a body of historical literature recorded about appearance in a region, and to see which entries were built from which observations, a catalogue is the right instrument, and it comes with its limit printed on the cover: appearance is not ancestry, and a face does not encode a percentage. An ethnicity estimate and a phenotype entry are both partial records of populations. Neither is an identity, and no instrument described here was designed to return one.
Frequently Asked Questions
- Is an ethnicity estimate the same thing as a DNA test?
- No. The test is the measurement: an array reads roughly 630,000 positions in a genome and produces a file. The ethnicity estimate is one report computed from that file by comparing it against a reference panel of sampled populations. Because panels get revised, the same file can yield different percentages in different years while the genotype itself never changes. A haplogroup assignment and a list of relative matches are further reports generated from the same file.
- Why do my ethnicity percentages change after an update?
- Because the denominator changed. A vendor that adds populations or replaces samples re-analyses every stored genotype against the new panel, and segments that previously fell inside a broad regional cluster can be reassigned to a narrower one. Reports print confidence ranges for this reason: a 90% interval is tighter than a 50% one, and neighbouring regions often overlap inside it. A shift after an update is expected behaviour, not proof that the earlier figure was wrong.
- Can a phenotype entry tell me my ethnicity?
- No. An entry describes a documented appearance pattern with a historical distribution, at a baseline roughly fifteen hundred years old. It is a statement about a sample recorded in the literature, not a measurement of a reader, and it carries no percentage. Visible traits vary continuously and overlap heavily between regions, which is one reason race does not function as a biological category. An entry is useful for understanding what was catalogued about a region, not for identifying a person.
Related Phenotypes
Faces from the encyclopedia that appear in this article. Open any entry for its full description, distribution, and references.
Armenid
Caucasus
Widespread type, found in its most specialised form in the mountains of Asia Minor. Associated with the ancient Cypriots and the Hittite Kin...
East Pamirid
Central Asia
The most Europoid Pamirid subtype. Most common in Pamiri speakers of the Pamir Mountains in Eastern Tajikistan and Northern Afghanistan, esp...
North Lappid
Northern Europe
Northern Lappid variety, somewhat closer to Sibirid, possibly due to Samoyedic influence. Associated with Eastern Saami (formerly "Lapps"), ...
Test what you learned
Put your eye for regional faces to work in the daily quiz — a composite face, a world map, and your best guess.