Ethnicity Guesser Tools: Three Methods, Three Answers
One search term covers three unrelated tools: genetic ancestry estimation, photo classifiers, and documented phenotype catalogues. Different inputs, different answers, and disagreements with identifiable causes.
Three tools share one name
Search the phrase and you will land on at least three unrelated products. One is a genetic ancestry service, which compares your markers against reference panels such as the 1000 Genomes Project and reports estimated proportions of continental ancestry. Another is a photo classifier, which accepts an uploaded picture and returns a label. The third is a documented phenotype catalogue paired with a map game, where you study a described appearance pattern and guess where in the world it was recorded. Their inputs differ, their outputs differ, and so do their failure modes. Only the name is common ground.
Because the name is shared, people compare the three as competing answers to one question. They are not. A saliva sample and a photograph measure different things, and a catalogue entry measures nothing at all; it reports what earlier researchers described. Admixture estimates arrive with confidence intervals that widen sharply as the geographic scale narrows, so continental proportions can be fairly stable while a claim about one province rests on far fewer reference individuals. A photo label carries no interval, which is exactly why it can appear more decisive than the evidence behind it.
What ancestry estimation can and cannot claim
Any ancestry service has to work around a number that has framed this field since 1972. In that year Richard Lewontin surveyed blood groups and proteins across human populations and estimated that roughly 85% of genetic variation sits within populations rather than between them. Estimation is still possible because the remaining fraction is not zero and because many markers are correlated with geography. What such a service reports is similarity to reference samples, expressed as proportions: a measurement of relatedness to panels, not a verdict on who someone is.
Two widely cited results show how much the framing matters. Rosenberg and colleagues ran a clustering analysis on 377 microsatellites from 1,056 individuals in 52 populations and recovered groups that track geography, but the number of groups was chosen by the analysts rather than discovered in the data. Tang and colleagues later found that clusters built from ancestry-informative markers broadly coincide with self-identified groups in a United States sample. Witherspoon and colleagues added a sharper caveat in 2007: individuals can usually be assigned to the right population given enough markers, yet how closely a person resembles members of their own group varies enormously from person to person.
What a photo classifier actually measures
The ancestor of today's face models is the eigenface method published by Matthew Turk and Alex Pentland in 1991, which compressed face images into a small set of principal components. Modern systems replace that with learned embeddings from deep networks, but the pipeline still begins with labelled photographs. Those labels come from metadata or self-report, so a model learns both the categories its annotators used and the conditions of the photographs: exposure, lens, pose, and who happened to be photographed. Change the label set and you have changed the answer without touching a single face.
This is why the output looks more specific than it is. A classifier asked to choose among five labels must return one of the five, whether or not the face belongs to any of them. Face recognition research gives a sense of the underlying difficulty: the 2019 NIST evaluation of demographic effects found false positive rates that varied by orders of magnitude across demographic groups, which shows how strongly performance depends on who is represented in the training data. A label is the output of a schema, and the schema was designed by people.
The catalogue describes instead of identifying
The third tool works differently. It comes out of the demic and typological literature of the twentieth century, including Carleton Coon's Races of Europe in 1939, Biasutti's four-volume survey, Eickstedt's classifications, and Lundman's geographic anthropology. Entries record appearance patterns that were described in samples and published with references. Armenid is documented in the mountains of Asia Minor and tied in that literature to ancient Cypriot and Hittite contexts. Litorid describes coastal European regions carrying Mediterranid and Dinaro-Armenid elements, running from Lebanon and southern Turkey through Cyprus, Greece, and Italy. Carpathid combines Gorid and Dinaro-Armenid elements around the Carpathians and is outnumbered by Dinarids in the high ranges.
Danakil is recorded in the Danakil depression of Eritrea and northern Ethiopia, where mean annual temperature exceeds 34°C, and is most often described among Afar communities. Read as a whole, the catalogue is a dated map of described patterns with a baseline of roughly 1,500 years ago. An entry states what was observed, where, and by whom. It says nothing about any living person's identity, and the entries are not ranked against one another.
Why the three answers diverge
The disagreements are structural. In 1962 the geneticist G. A. P. Livingstone argued that human variation is clinal, changing gradually across geography, so the boundaries between named groups are conventions rather than features of nature. Serre and Pääbo made the same point in 2004 using genome-wide markers, finding gradual gradients where continental categories imply edges. Physical traits behave identically. Nasal breadth, facial width, and pigmentation each vary continuously, and their ranges overlap heavily between regions, so almost any threshold cuts through people who resemble each other more than they resemble their own category's average.
Each tool resolves that continuity at a different scale. An ancestry panel reports at continental scale, a classifier at the scale of its label set, and a catalogue at the scale of a pattern described decades ago in one specific sample. Different frames, different answers. The problem is not that one of them is dishonest. The problem is treating an inference made under stated assumptions as though it were a fact about a person.
Where the map stops matching
The catalogue's baseline is historical, and a great deal has moved since. The later phases of the Bantu expansion, the transatlantic trade that forced more than twelve million people across the ocean, the Indian Ocean trade, Roman-era and subsequent steppe movements, Silk Road exchange, nineteenth-century urbanisation, and the displacements of the twentieth century all redistributed appearance patterns on a scale the older literature never saw. Contemporary long-distance migration continues the process. The catalogue sometimes admits as much: the Alföld entry describes a type that formed when Huns and Magyars entered the Hungarian plain in the early Middle Ages and blended the regional populations already there.
The practical consequence is that mixture is the ordinary case. Many people match no single documented entry, and asking which one they are is a category error rather than a difficult question. That does not make the catalogue useless. A dated historical record is valuable precisely because it is dated: it describes a state of affairs before modern mass mobility, and comparing it with the present is informative as long as the comparison is made honestly.
Frequently Asked Questions
- Is an ethnicity guesser the same thing as a DNA test?
- No. A DNA test genotypes markers, compares them with reference panels, and reports estimated proportions of ancestry, which is a measurement carrying an interval. A phenotype catalogue reports what researchers described in historical samples, and a map game scores whether you can recognise those descriptions. The three share a search phrase because they all concern human variation, not because they share an input, a method, or a standard of evidence.
- Why do ethnicity guesser tools disagree with each other?
- Because each one fixes a different frame. A classifier returns whichever label its training schema contains, so the label set determines the answer. An ancestry panel depends on which reference populations it holds. A catalogue entry depends on which decades of literature it draws from. Where trait distributions overlap, small changes in frame move the answer, which makes disagreement the expected outcome rather than evidence that a tool is broken.
- Can a phenotype entry tell me my own ethnicity?
- It cannot, and it does not try. Entries describe appearance patterns documented in historical samples with a baseline of roughly 1,500 years ago, and they carry no information about anyone alive now. Appearance is also a poor proxy for ancestry: pigmentation and facial proportions are influenced by a modest number of genes and by climate, so two people with similar ancestry can look unlike each other, and two people with different ancestry can resemble each other closely.
Related Phenotypes
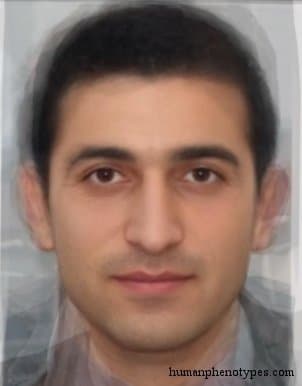
Faces from the encyclopedia that appear in this article. Open any entry for its full description, distribution, and references.
Armenid
Caucasus
Widespread type, found in its most specialised form in the mountains of Asia Minor. Associated with the ancient Cypriots and the Hittite Kin...
Litorid
Middle East
Type of coastal European regions that contains Mediterranid and Dinaro-Armenid elements. Probably the result of ancient migrations from Asia...
Carpathid
Eastern Europe
European type with Gorid and Dinaro-Armenid elements. Common around the Carpathian Mountains of Central Eastern Europe, e.g. in Huzulis and ...
Danakil
East Africa
Specialised Ethiopid type living in the hottest region of the world: the Danakil depression of Eritrea and Northern Ethiopia, with an annual...
Test what you learned
Put your eye for regional faces to work in the daily quiz — a composite face, a world map, and your best guess.