How Accurate Is AI Ethnicity Detection? One Number, Two Directions
Accuracy is two conditionals, not one, and published figures almost always report the flattering one: how often the tool names a label that is present.
Two questions sit inside one word
Accuracy is correct answers divided by attempted answers, and that ratio answers only one of the two questions a person asks. The first is how often the tool names the right label when the right label is present. The second is how often the label it names is the right one. Both are computed from the same table of answers, they are not the same number, and a page that prints one percentage has usually printed the first. Statistics calls them recall and precision. Biometrics calls them the false negative and false positive rates at a stated threshold, which at least names the threshold.
The clearest published instance comes from face recognition, because that is the one part of this field where numbers are reported under a rule. NIST's Face Recognition Technology Evaluation does not publish accuracy. It publishes a false negative rate at a fixed false positive rate, usually 0.001, and repeats the exercise at 0.0001 and 0.00001. Under that convention one submitted algorithm scores a false negative identification rate of 0.0017 at 0.001 on mugshot photographs, and 0.0120 at the same operating point when the probe is a webcam frame. Identical software, identical threshold, seven times the error, because the camera moved.
The table a percentage is hiding
Construct the table once and the arithmetic stops being abstract. Take two hundred photographs sorted into five historical patterns, contributing 100, 40, 30, 20 and 10 faces each. A model recovers 82, 26, 19, 9 and 5 of them. That is 141 correct out of 200, or 70.5 per cent, which is the number that would reach a headline. Read the same answers down the columns instead of across the rows and the picture changes. The model returned the first pattern 93 times and was right on 82, so that answer is correct 88 per cent of the time. It returned the fifth 13 times and was right on 5, so that answer is correct 38 per cent of the time.
Nothing about those 200 answers changed between the two readings. Across the rows the fifth pattern is recovered half the time, which sounds passable. Down the column, a person told they match it has a worse than even chance of having been told the truth, which sounds like a different product. The pooled figure of 70.5 per cent is not wrong; it describes the test pool rather than any single answer. A tool that publishes only that figure has chosen the reading which flatters every individual response it makes.
Why the rare labels lose first
Precision also depends on something outside the model: how often the answer occurs in the pool of images being judged. Suppose a pattern accounts for 3 per cent of what a tool receives, the tool recovers 80 per cent of those faces, and it applies the label wrongly to 5 per cent of the faces that are not that pattern. In ten thousand photographs, 300 carry the pattern and 240 are caught. Of the remaining 9,700, another 485 receive the label. So 725 answers carry it and 240 are right, which is 33 per cent. The model hit every rate it claimed, and two of the three people given that answer were given a wrong one.
Repairing that does not mean a better model in the abstract. With the same 3 per cent prevalence and the same 80 per cent recall, precision reaches four answers in five only when the false positive rate on that label falls to about 0.6 per cent, eight times stricter than the 5 per cent assumed a moment ago. Saito and Rehmsmeier set out the general case in PLoS ONE in 2015, arguing that precision-recall curves describe imbalanced problems better than ROC curves do, because the first reports the fraction of true positives among positive predictions while the second stays visually reassuring as the base rate shifts beneath it.
A menu of 209 is not 209 hypotheses
The catalogue behind this site holds 209 documented patterns, and their recorded coordinates make the rarity argument concrete. Measured as great-circle distances between those locations, the median entry has another entry within 395 kilometres. Forty entries have a neighbour inside 200 kilometres, eleven inside 100, and the closest pair sits 40 kilometres apart. Four from western Asia show the scale: Armenid and Mtebid are 368 kilometres apart, Proto Iranid and Transcaspian 865, Armenid and Proto Iranid 1,322. A model choosing among those four is not choosing among continents.
The entries say as much themselves. Mtebid is recorded as probably an Alpinised Dinaro-Armenid adapted to mountain life among Georgians, Chechens and Ossetians. Transcaspian is described as a contact type formed among the Joresmi, Alans and Sogidans through admixture in the first millennium. Proto Iranid is called transitional to Berberid in the west. Those neighbours are also what eats a label's precision. A model that still confuses Armenid with a pattern 368 kilometres away puts every such face into Armenid's column, which is exactly the mechanism the 3 per cent calculation described.
Balanced test sets buy one number, not two
Benchmarks are usually balanced on purpose, and balancing solves the recall problem while creating a precision problem. FairFace, published by Kärkkäinen and Joo in 2021, is explicit about it: 108,501 images spread across seven declared groups, deliberately even. Even groups mean each label has roughly the same prevalence in the test pool, which is the condition under which precision and recall converge. Report precision from such a pool and you have measured a world in which the seven groups are equally common. No deployment pool looks like that, so the precision figure does not travel, even though the recall figure survives the trip reasonably well.
That asymmetry is worth stating plainly, because it explains a lot of confident marketing. Recall is a property of the model and of the label it was trained to find; it moves slowly when the pool changes shape. Precision is a ratio between two kinds of error, and it moves whenever the mix of inputs moves. A vendor can therefore quote a recall figure that will still hold next year and a precision figure that will not hold next month, and both statements can be true. The number a user actually needs when reading an answer is the second one.
A rate needs trials, and you have one
Every figure above is a frequency over a set of trials. A person who uploads one photograph has run one trial, and a frequency is not defined for a single event. What would apply is a probability about a person, and neither recall nor precision supplies one, because both describe a procedure applied to a population rather than a property of the face in front of the lens. What a single answer can honestly support is a statement about the training corpus: this pattern was recorded in these places, by these authors, at this date. That is a claim about a document, and it can be checked.
The document is also older than the population it is applied to. The catalogue's distributions are reconstructed for a baseline of roughly 1,500 years ago, and movement since then has rearranged them. Between 1970 and 2020 the number of people living outside their country of birth rose from 84 million to 281 million, while their share of the world population moved only from 2.3 to 3.6 per cent, so the absolute growth is real and the popular reading of a migration explosion is not. Either way, a rate measured on a 1,500-year-old map describes a map, not the queue at a passport desk.
What a page can print instead
None of this makes the numbers unusable; it makes them incomplete, and the missing parts are clerical rather than experimental. A tool page that published the four items below would let a reader check the arithmetic instead of trusting the adjective printed in front of it, and would let someone reproduce the result a year later, after the label list had changed underneath it. This site runs a quiz of its own and is not a neutral party in the comparison, but the quiz asks nothing about you: it shows a composite and asks where a pattern was recorded.
- Precision beside recall for each label, computed on a pool whose composition is stated in the same sentence.
- The threshold the product actually applies, with the false positive rate at that threshold.
- Whether the test pool was balanced by design, and what that balancing did to the precision figures.
- One worked example: how many answers carried a given label, and how many of those were right.
Frequently Asked Questions
- How accurate is AI ethnicity detection?
- There is no single figure, because accuracy is measured in two directions. Across the rows, a tool can recover a fair share of each pattern. Down the columns, the answers it gives are right far less often, especially for patterns that arrive rarely in the pool of images it receives. Reporting one number hides which direction was measured, and the direction matters more than the value. Any figure also needs the label set, the test pool and the threshold beside it, or it cannot be checked by anyone.
- Why do two accuracy figures for the same tool disagree?
- Because they are probably measuring different things. One may be pooled accuracy over a balanced test set, another per-label recall, another the share of returned labels that were correct. Balanced test sets raise precision by construction, and deployment pools are rarely balanced. A third cause is the input channel: NIST's own evaluations show one algorithm moving from 0.0017 to 0.0120 in false negative identifications when the probe photograph comes from a webcam rather than a mugshot station.
- Does a high accuracy score mean the answer about my face is right?
- No. A rate describes a population of trials, and a single upload is one trial. Even inside the tested population, an answer is only as reliable as the prevalence of that label and the false positive rate the tool runs at. What an answer can support is narrower and more useful: that this documented pattern was recorded in these regions, by these authors, at this date. That is a statement about a record, and it is not a verdict on the person in the photograph.
Related Phenotypes
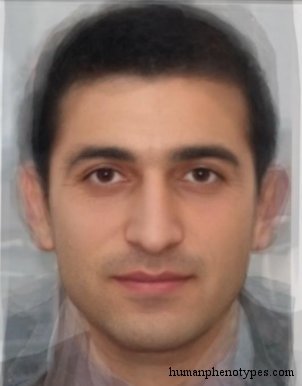
Faces from the encyclopedia that appear in this article. Open any entry for its full description, distribution, and references.
Armenid
Caucasus
Widespread type, found in its most specialised form in the mountains of Asia Minor. Associated with the ancient Cypriots and the Hittite Kin...
Mtebid
Caucasus
Regional type of the Caucasus Mountains. Probably an Alpinised Dinaro-Armenid adapted to life in mountainous regions. Mtebids are typical of...
Proto Iranid
Middle East
Coarse type of Iran and Asia Minor, that can be considered an eastern Eurafricanid variety. More ancient than the more gracile Iranids and P...
Transcaspian
Central Asia
West-Central Asian Orientalid with Aralid admixture, particularly common in Turkmens. Significantly differs from other Central Asians by lon...
Test what you learned
Put your eye for regional faces to work in the daily quiz — a composite face, a world map, and your best guess.