Human Phenotypes List: What 209 Rows Actually Count
The catalogue lists 209 human phenotypes across 22 regions, and the rows per region record where observers went rather than how many people live there.
A count is not a census
The catalogue holds 209 named entries, filed under 22 regions. Divide one number by the other and the average comes out at 9.5 entries per region, which is the least useful statistic in the whole collection. The distribution underneath it runs from 20 rows for South Asia down to a single row for the Arctic, with the median region holding 8. A reader who takes those figures as an inventory of human variety will read them backwards. Each row is a described pattern, averaged from a sample and pinned to a location, and the number of rows attached to a place measures how much attention that place received.
There is a second reason the arithmetic misleads. A region's row count is bounded by the number of observers who worked there and the number of monographs they published, not by any measurable property of the people living in it. Regions with long research infrastructure in the colonial period, and regions whose skeletal collections ended up in European museums, generated entries by the dozen. Places that were hard to reach, sparsely settled, or simply unfashionable within the discipline generated one or two and stopped. The list is closer to a bibliography with faces attached than to a census.
Where the rows are dense
The regional counts are worth reading in full, because the order in which they fall is not the order most readers expect. South Asia leads with 20 entries, followed by Southeast Asia, Sub-Saharan Africa and East Africa at 17 each, then South America at 15, Northern Europe at 14 and West Africa at 13. East Asia and North America hold 11 apiece, North Africa 10, the Middle East 9. At the other end sit Polynesia at 4, the Caucasus and Southeastern Europe at 2 each, and the Arctic at 1. Twenty-two drawers, no two of them filled the same way.
Latitude cuts the same collection differently. Of the 209 entries, 159 sit north of the equator and 50 south of it. Sorted into bands, 78 fall between the equator and 30 degrees north, 64 between 30 and 60 degrees north, and 17 above 60. South of the equator the bands thin quickly: 38 entries between 0 and 30 degrees south, 12 between 30 and 60, and none at all below 60 south. That empty band is the plainest single statement the list makes about itself. Nothing in Tierra del Fuego, nothing along the Antarctic rim, no row to fill.
Two entries at the ends of the map
The two extreme rows are Inuid at 77.6 degrees north, on the Greenland coast, and South Fuegid at 54.4 degrees south, in southern Chile. Inuid is the only Arctic entry and the only one whose description calls itself the northernmost pattern in the world. It is anchored on the Inughuit of North Greenland and was named and defined by Georg Neumann in a 1952 chapter on archaeology and race in the American Indian. Nine sources sit behind that single row, two more than the median entry carries.
South Fuegid was split from the broader Fuegid type by Jose Imbelloni in 1937 and given its present name by Egon von Eickstedt in 1952, with Martin Gusinde's three-volume account of the Fuegian peoples standing as its detailed description. Ten citations support it. Its record also notes what happened after the measuring stopped: the populations it described declined sharply through the twentieth century, and the Chonos and Changos it lists alongside the Yaghan and Kawesqar are recorded as extinct. A row can outlive the people it was drawn from, and this one did.
The expedition behind a row
The densest region has an equally traceable cause. South Asia's 20 entries rest heavily on one journey: Eickstedt's 1929 field season in South India, published as Anthropologische Forschungen in Sudindien. Out of that work came the Malid type, named from a Dravidian word for mountain, described from small communities in the hill forests of the far south and anchored at 10.2 degrees north. Three of its seven citations are Eickstedt's own, and Biasutti built his Malica variety on the same material. One expedition, followed by a chain of self-citation, produced a permanent shelf.
The same mechanism is visible at the other end of the continent. East Shanid, anchored at 19.8 degrees north in the plains and river valleys running from northern Thailand into Laos, was named by Eickstedt in 1937 in a two-part history of anthropological naming and classification. Five citations hold it up, the fewest of the four entries discussed here, and four of those five are general syntheses rather than primary fieldwork. A thinly documented row and a heavily documented one sit side by side, indistinguishable to a reader who sees only the name.
Three ways to sort the same names
Because the entries are names with data attached, the sort order is a choice, and each choice discards a different part of the information. Three orders are available in practice, and they are not interchangeable: one is convenient, one is the compilers' own, and one is a measurement. Reading the catalogue through the wrong one is how a historical document starts to look like a natural system.
- Alphabetical. Fast for lookup and destructive for meaning. Bantuid, Borreby and Brachio Melanesid end up adjacent despite sitting on three continents, and every regional gradient disappears between the pages.
- Regional. The order the compilers used, and the only one that preserves adjacency. It is also the order that produced the imbalance, because a region with one entry gets one page and a region with 20 gets twenty.
- Latitude. The single continuous axis in the file. Resorted this way the entries run from Inuid at 77.6 degrees north to South Fuegid at 54.4 degrees south, and the thin stretches of the middle range become visible as thin rather than as merely distant.
What 1,465 citations hold up
Every row carries its sources, and the totals are more modest than the shelf suggests: 1,465 citations across the 209 entries, drawn from 361 distinct works, a median of 7 per entry. Those works are not evenly spread. Biasutti's Le Razze e i Popoli della Terra, in its 1967 fourth edition of a 1941 original, is listed on 147 of the 209 entries. Eickstedt's 1934 Rassenkunde und Rassengeschichte der Menschheit and Lundman's 1967 Geographische Anthropologie follow at 108 each, Knussmann's 1996 textbook at 68, and Coon's 1939 The Races of Europe at 34.
That concentration decides how the list should be read as evidence. Two rows sharing four of their five citations are not two independent observations of two places; they are one framework applied twice, and the difference between them may be a difference of emphasis rather than of data. The catalogue shows this openly by printing the references on every page. Counting them is the fastest way to separate entries built on fieldwork from entries that restate a synthesis which had already hardened into a type, and the spread is wide: 11 entries cite three works or fewer, while 9 cite twelve or more.
The rows the twentieth century outran
The distributions are anchored to roughly 1,500 years ago, and several entries record what happened afterwards. East Shanid's description says the type probably moved south from China in historic times and outnumbered older populations in the region, and that later Sinid influence reached some communities more than others, so the Lao, Northern Thai and Tay are recorded as closer to the original description than the Dai, Akha or Vietnamese. That is a migration note inside a physical description, written by the same authors who drew the type.
The general point is larger than any single row. A catalogue compiled between roughly 1880 and 1980 caught a set of distributions just before the century's largest population movements rearranged them: rural to urban migration, the partition of India, the displacements of the Second World War, and the post-1945 labour migrations into western Europe. None of those events created new entries. The names stayed, the coordinates stayed, and the distributions they describe stopped matching the ground. That mismatch is not a defect in the list. It is the list behaving as a document with a date.
Frequently Asked Questions
- How many human phenotypes are in the list?
- The catalogue holds 209 named entries filed under 22 regions, from South Asia at 20 rows down to the Arctic at a single row. That number is a count of described patterns, not of people or of distinct human kinds. Entries were added as observers published descriptions of a region, so the total reflects the reach of nineteenth and twentieth century anthropology more than any property of the populations themselves.
- Why does one region have far more entries than another?
- Row counts track research attention. A region with a long field tradition, accessible sites and collections shipped to European museums accumulated entries steadily, while remote or unfashionable regions got one or two and stopped. South Asia's 20 rows lean on Eickstedt's 1929 South India expedition and the literature that followed it. The Arctic has one row, Inuid, defined by Neumann in 1952.
- Can the list tell me what a living person looks like?
- No. Each entry describes a documented tendency averaged across a historical sample, anchored to a distribution as of roughly 1,500 years ago. It cannot describe an individual, and it was not built to. Migration since then, including the large movements of the twentieth century, has separated many of those distributions from the places they were mapped onto, which is why the catalogue is best read as a dated historical record rather than a description of anyone alive.
Related Phenotypes
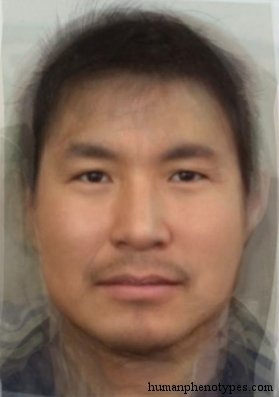
Faces from the encyclopedia that appear in this article. Open any entry for its full description, distribution, and references.
Inuid
Arctic
Eskimid proper type, ranging over the vast, sparsely populated tundra along the icy coasts of Alaska, Nunavut, and Labrador (Canada) to Gree...
South Fuegid
South America
The most characteristic Fuegid variety, adapted to the cool climate of Southern Chile. Named after Tierra del Fuego. Often considered part o...
Malid
South Asia
Very ancient phenotype native to the mountains of South India, common in isolated groups of Kanikkaran, Kadar, and Paniya. Mixed with Melani...
East Shanid
Southeast Asia
Eastern variety of Shanid, weakly influenced by Veddid. Typical for the plains and river valleys of Indochina, especially from North Thailan...
Test what you learned
Put your eye for regional faces to work in the daily quiz — a composite face, a world map, and your best guess.