AI Ethnicity Test: What a Measurement Would Require
A laboratory test has a reference standard, a defined construct and a published error bar. A face-based ethnicity tool owns none of those, and the output it does return is a ranking rather than a measurement.
What earns the name test
In measurement, a test is not a verdict. It is an instrument with a documented reference. A thermometer is calibrated against fixed points, and the triple point of water at 273.16 kelvin is one of them. Blood glucose assays are anchored to isotope-dilution mass spectrometry. The instrument is trusted because something independent defines what its numbers mean, and because a range of error is published alongside every reading. Metrologists call that something the standard, and the apparatus of measurement exists to trace a reading back to it. A tool that claims to test ethnicity from a photograph has no such anchor, and that absence is not an implementation detail. It is the line between a measurement and a modelled guess.
Ancestry is a relationship, not a quantity
The obvious candidate for a reference standard is ancestry, and ancestry turns out to be the wrong kind of thing to calibrate against. In a 2020 opinion piece in PLOS Genetics, Iain Mathieson and Aylwyn Scally separate three ideas that are routinely conflated: genealogical ancestry, genetic ancestry, and genetic similarity. They argue that most statements described as being about ancestry are really statements about genetic similarity, and that genetic data are surprisingly uninformative about ancestry itself. Their account makes ancestry relational. It is information about people and their relationship to you, rather than a property sitting inside you waiting to be read out.
Genetic structure is also continuous rather than partitioned. Novembre and colleagues analysed roughly 3,000 Europeans and found that the leading axes of genetic variation align with geography, producing a gradient across the continent rather than a set of separated groups (Novembre and colleagues 2008). A gradient can be sampled, and a sample can be compared against a reference panel. What it cannot supply is a pass or fail, because there is no boundary in the data for a threshold to sit on.
What the number on the screen is
Tools of this kind usually return a short list of labels with percentages attached. That output is a softmax over the training label list. The numbers rank the classes the model was taught and are normalised to sum to one, which is why every face receives a full set no matter how poorly it fits any of them. They are not frequencies of anything in the world, and they are not calibrated. Chuan Guo and colleagues showed in 2017 that modern deep networks are systematically overconfident, with expected calibration error on CIFAR-100 near 16% for a ResNet-110 before recalibration (Guo, Pleiss, Sun & Weinberger, ICML 2017). A display reading 87% is a ranking, not a claim that 87 of 100 comparable faces share that background.
Where an instrument's scales come from
Instruments get borrowed across purposes, and the borrowing leaves marks. The Fitzpatrick scale is the clearest example in this space. Thomas Fitzpatrick proposed it in 1975 to choose a starting ultraviolet dose for photochemotherapy in psoriasis, and the first version ran from type I to type IV; the six-type scheme in use now is a later extension. It classifies photosensitivity, the tendency to burn or tan, not ancestry. It is nevertheless reused as a skin-tone variable in image datasets, where it stands in for a population category it was never built to represent.
The pattern is worth naming, because it is how a great deal of dataset engineering works. A variable is created for one purpose, found convenient, and then carried into a second purpose with its original validation left behind. The scale still does useful work in dermatology, where it guides dosing and sun-protection advice. The problem is not the scale. The problem is what happens when a clinical variable is asked to stand in for a social one, and the substitution is never written down.
Test and retest on the same face
Reliability asks a question a laboratory test answers inside its report: how much does the same measurement move when nothing meaningful has changed? A glucose assay arrives with a precision figure and a reference interval. A face-based ethnicity tool usually returns a single number and no interval, which means a user cannot separate 62% from 68% in any principled way. Without a stated repeatability there is no way to distinguish a stable property of the input from ordinary variation in the pipeline. The missing error bar is the missing half of the test.
There is a deeper version of the same problem. A test presupposes that the thing being measured holds still long enough to be measured. Ethnicity as a category does not: it is assembled differently in different states, renamed across decades, and split or merged as politics changes. A measurement device can be recalibrated when its reference drifts. A label list that is redefined every decade cannot be recalibrated, only replaced, and every replacement invalidates the numbers that came before it.
Panels, and the date on them
Genomic ancestry panels are the useful contrast, because they can be validated. A panel is a fixed set of markers chosen to separate reference populations, and its accuracy is quoted against those references and their documented provenance. The HGDP-CEPH diversity panel drew roughly 1,064 individuals from 51 populations, and the third phase of the 1000 Genomes Project covered 2,504 individuals across 26 populations. Those are large, carefully described sets, and they are still finite samples with a collection date attached. A person whose recent relatives come from three of those populations at once has no single reference row to match.
That snapshot quality matters because panels are used to answer questions about people who keep moving. Two-thirds of the world's international migrants live in just twenty countries, and the largest single corridor, from Mexico to the United States, is close to eleven million people. A reference set records where people were sampled, not where they or their children will be. Even a genomic panel, with a genuine reference standard behind it, reports relative to a chosen set of populations rather than to a natural partition of humanity.
What a documented entry contains instead of a score
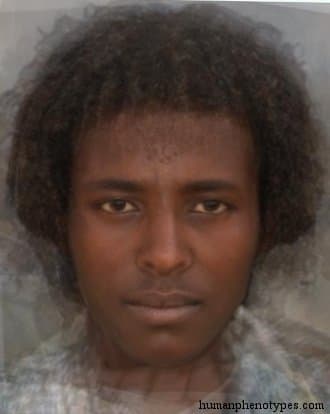
The catalogue on this site is a different kind of object, and it is worth being explicit about what it holds. Each entry describes a documented appearance pattern and the places where the older literature reported it. Danakil is recorded for the Danakil depression and reported most often among Afar and southern Saho communities. Mundu Mangbeto is described as an intermediate pattern of the northeastern Congo forest, between the tallest and shortest extremes in the record. South Australid is associated with the Murray basin and is now nearly absent in unmixed form. Fengu-Pondo is tied to the Bantu expansion and to assimilated Khoisan elements in South Africa's eastern provinces.
Those are distributional statements with sources behind them, and they are dated to a baseline of roughly 1500 years ago. None is a threshold, a score, or a verdict on an individual. If the question is descent, a genomic estimate with a stated reference panel is the right instrument and publishes its own limits. If the question is appearance, a documented catalogue describes patterns and regions without claiming to classify a face. If the question is identity, no measurement applies, because the term covers language, community and self-description.
Frequently Asked Questions
- Can AI really test my ethnicity from a photo?
- It can label a photo. A model trained on annotated images returns one of the categories in its training list, with a score for each. What it lacks is a reference standard. A laboratory test is trusted because something independent defines what its numbers mean and how far they can move. Ethnicity has no such anchor, since ancestry is a relationship between people rather than a measurable property of one.
- Why do the percentages look so precise?
- Because a softmax has to add up to one. The output layer turns scores into a distribution across the label classes, so every face gets a full set of numbers however badly it fits any of them. Modern deep networks also tend to be overconfident, which pushes the largest number higher than the evidence supports. The precision is a property of the arithmetic, not of the knowledge.
- What should I use instead of an ethnicity test?
- Decide which question you are asking. For descent, a genomic ancestry estimate with a stated reference panel is the right instrument, and its limits ship with it. For appearance, a documented catalogue describes patterns, regions and sources without claiming to classify a face. For identity, the answer is not a measurement at all, because the term covers language, community and self-description.
Related Phenotypes
Faces from the encyclopedia that appear in this article. Open any entry for its full description, distribution, and references.
Danakil
East Africa
Specialised Ethiopid type living in the hottest region of the world: the Danakil depression of Eritrea and Northern Ethiopia, with an annual...
Mundu Mangbeto
Sub-Saharan Africa
Intermediate type of the Northeastern Congo forest. Unique in connecting elements of the tallest (Nilo-Hamitic) and shortest (Bambutid) phen...
South Australid
Australia
Australid subtype with proto-Caucasiform features associated with the people of the Murray basin of Southeastern Australia. Originally the m...
Fengu-Pondo
Sub-Saharan Africa
Bantuid variety, similar to South Bantuid, but with weak Khoisan influence, placing it closer to Xhosaid. Developed as a result of the Bantu...
Test what you learned
Put your eye for regional faces to work in the daily quiz — a composite face, a world map, and your best guess.