Can a Phenotype Tell You Your Ethnicity? What the Entry Holds
A phenotype entry records measurements from a historical sample, while ethnicity is a boundary that states and people draw with different instruments.
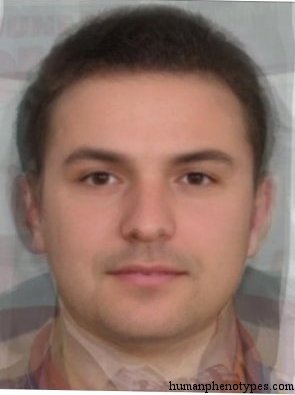
Two words from different systems
A phenotype is a set of observable traits, and its history is a history of instruments: calipers, colour chips, photographic plates. Ethnicity is a boundary that people and states draw, with a name attached, a claimed descent, often a language, sometimes a territory. One is recorded by measuring a body. The other is recorded by filling in a form. The two correlate, and the correlation is real, but it comes from shared geography rather than from one being a readout of the other.
The confusion is understandable, because faces are how people estimate ethnicity in ordinary life, and those estimates are often roughly right about a region. That is a success at detecting where someone's recent ancestors probably lived, since visible traits and childhood residence are both geographically clustered. It is not evidence that a face carries an ethnic label. A person who moves does not change phenotype, and a border that moves does not change it either.
What a catalogue entry actually contains
The 209 entries share a shape: a slug, a coordinate, a paragraph of physical traits, a reference list, and a note on where the type was recorded. The names are nearly all place-derived. West Alpinid comes from the western Alps, where Broca's 1868 memoir on French anthropology already located a short, round-headed mountain population around Disentis, Savoy and the Auvergne. Ishikawa takes its name from a region of Honshu, described by Matsumoto in 1921 as a type carrying an old island element. Danakil comes from the depression in Eritrea and northern Ethiopia where mean annual temperature runs above 34 degrees Celsius. Places can be visited and dated, which is why the vocabulary is built this way.
Entries do mention groups, in phrases such as most common in or occasionally in. Those phrases record where the samples were drawn; they are not definitions. The distinction matters because the catalogue's baseline sits roughly 1500 years ago, and most of the ethnonyms in use today postdate it. A label fixed to a place survives a change of rulers, languages and names. A label fixed to a people would not have survived at all, which is why the anthropologists reached for mountains and provinces instead.
Most of the variation sits inside, not between
The genetic case has been made twice with unusual clarity. Lewontin, in a 1972 chapter on the apportionment of human diversity, partitioned variation at blood group and protein loci and found about 85 percent of it within populations, roughly 8 percent between populations inside a conventional race, and 6 percent between races. Rosenberg and colleagues repeated the exercise in 2002 with 377 microsatellites in 1,056 people from 52 populations, and found structure that supports clustering while most variation remained inside groups. The clusters are real. They are also shallow.
Wright's Fst for humans is usually estimated near 0.12, meaning that around 12 percent of variation lies between populations and the rest within them. Two people drawn from different labelled groups will often be more similar to each other than two drawn from the same group. Individual assignment therefore has to be probabilistic, and the probability is usually modest. A test can say that a genome is more consistent with one region than another. It cannot say what someone is, because the category it would be assigning is not a genetic object.
A handful of loci carry the visible signal
The traits people read off a face rest on a small number of loci. SLC24A5 carries rs1426654, a missense change that swaps alanine for threonine at position 111 and reaches near fixation in European populations while remaining common in much of South Asia. SLC45A2 contributes to the same pigment pathway. Eye colour in European samples is dominated by HERC2 and OCA2, where rs12913832 sits in an enhancer that regulates OCA2 expression. Red hair runs through MC1R variants such as Arg151Cys, Arg160Trp and Asp294His. A dozen loci can carry most of what a photograph shows.
EDAR is the clearest case of one variant carrying a bundle. V370A, or rs3827760, is near fixation in East Asian populations and present in Native American ones, and it is associated with thicker hair shafts, shovel-shaped incisors and a higher density of eccrine sweat glands. One substitution, three systems. That is a useful corrective to the intuition that a trait is a unit. A face presents a bundle of traits that co-occur because a few variants each affect several of them, and the bundle is not a category with a border drawn around it.
The map moved after the catalogue closed
The catalogue describes a map that has since been rearranged. Postwar labour recruitment moved millions of people into industrial western Europe: West Germany signed agreements with Italy in 1955, with Spain and Greece in 1960, with Turkey in 1961 and with Yugoslavia in 1968. Decolonisation moved others in the opposite direction. The 2022 displacement from Ukraine put several million people into neighbouring countries within months. Labour migration to the Gulf assembled populations in cities where the catalogue recorded sparse settlement at best.
Mixture at that scale does not erase the patterns the catalogue describes; it separates them from the places that named them. A child of two regions carries traits drawn from both, in proportions no caliper can decompose. That is the ordinary condition of most large cities now, and it is why an honest answer to the question has to be given about samples rather than about the person in front of you.
The label is assigned by a form
Ethnic categories are made by institutions and revised on schedules that have nothing to do with biology. In the United States, the 1997 revision of Statistical Policy Directive 15 set five minimum race categories and kept Hispanic or Latino as a separate ethnicity, so that one form asks two different questions in two different ways. In March 2024 the same office added a Middle Eastern or North African category and moved toward a single combined question. The categories changed while the faces in the population did not.
The United Kingdom runs a different list. The 2021 census for England and Wales offered 19 ethnic groups and reported 81.7 percent White, 9.3 percent Asian or Asian British, 4.0 percent Black or Black British, and 2.9 percent Mixed or multiple. A person with the same face lands in different boxes depending on which state's form is in front of them, and on how they choose to answer it. Nothing in a phenotype entry can predict that choice, because the entry has no access to it.
Why individual assignment fails on base rates
Individual assignment also runs into arithmetic. Suppose a trait pattern has a 1 percent prevalence in the population being screened, and a classifier identifies it with 95 percent sensitivity and 95 percent specificity. Of 10,000 people, 100 have the pattern and 95 of them are correctly flagged; of the 9,900 who do not, 495 are wrongly flagged. A positive result is therefore right about 16 percent of the time. Make the pattern rarer and the figure falls further. Accuracy quoted without a base rate says very little about a single answer.
What a phenotype entry can do is narrower and more solid. It can name a documented pattern, place it at a coordinate, and cite who described it and when. It can support a quiz in which the answer is a distance on a map, measuring how well a composite face was recognised and nothing about the player. It cannot tell anyone their ethnicity, because ethnicity is declared, assigned or claimed, and a measurement has no way to read a declaration off a jaw.
Frequently Asked Questions
- Does a phenotype determine ethnicity?
- No. A phenotype is a description of observable traits in a sample, and ethnicity is a social boundary that is declared, assigned by a form or claimed by a person. The two overlap geographically, which is why a face often hints at a region, but overlap is not determination. Many people carry traits that are common well outside the group their documents name, and many carry traits that are rare inside it.
- Why do DNA tests and phenotype descriptions disagree?
- They measure different things at different resolutions. A phenotype entry is a set of caliper and colour observations made on a historical sample. An ancestry test compares a genome against a fixed panel of reference populations chosen by whoever built the calculator. Neither is a statement about identity, and the panel's choice alone can move an estimate by many percentage points, which is why two services can report different shares for one person.
- Can a face be assigned to a country?
- It cannot be done reliably, or in principle. Visible traits vary clinally, crossing borders without regard to them, and most of the underlying variation sits within populations rather than between them. A classifier trained on national photographs learns the appearance of whoever was photographed, not the appearance of a nation. The result is a probability about a sample, not an assignment of a person, and the arithmetic of rare categories makes single answers mostly wrong.
Related Phenotypes
Faces from the encyclopedia that appear in this article. Open any entry for its full description, distribution, and references.
West Alpinid
Central Europe
Alpinid proper, historically found in the mountain regions of Western Europe. Often a cohabitant of a second mountain type, the Dinarid. The...
Ishikawa
East Asia
Special Japanese type, influenced by ancient regional elements. Named after the Ishikawa region of Honshu. Probably represents admixed varia...
Danakil
East Africa
Specialised Ethiopid type living in the hottest region of the world: the Danakil depression of Eritrea and Northern Ethiopia, with an annual...
Test what you learned
Put your eye for regional faces to work in the daily quiz — a composite face, a world map, and your best guess.