DNA Ancestry From a Photo: The Signal Only Runs One Way
A photograph records reflected light, not a sequence, so no amount of analysis can recover a genotype from it, and the tools that do work run the other way.
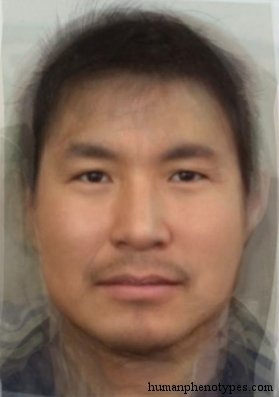
A photograph carries no DNA
The phrase describes a channel that does not exist. A photograph is a record of reflected light: three broad bands of intensity sampled across a grid, at one instant, under one illuminant, through one lens. A genotype is a chemical readout of positions in a molecule. Nothing in the first is a degraded copy of the second waiting to be sharpened, and no method recovers a sequence from a picture, because the picture never held one. A service offering to read DNA ancestry from a selfie is therefore selling an inference it did not make from the file it received.
It is worth being exact about what the photograph does contain, because the confusion usually starts there. Skin, hair and eye colour are visible, and so are the proportions of a face and the thickness of a lip. Those are phenotypes, produced where a genotype met a developmental history. The genotype is one input among several, and the mapping runs in a single direction with losses at every step. A photograph records the output of that mapping and nothing else, which is why the same face at eight and at eighty belongs to one genome.
What DNA can actually predict
The forward direction is real, and it is smaller than most people expect. Forensic DNA phenotyping exists as a validated laboratory product. The HIrisPlex-S system, published by Lakshmi Chaitanya and colleagues in Forensic Science International: Genetics in 2018, targets 41 single nucleotide polymorphisms across two multiplex assays, and its three statistical models return probabilities over three eye colours, four hair colours and five skin colour categories. Complete profiles were obtained from 63 picograms of input DNA, a quantity far below what a visible stain supplies.
Read the specification and note what is absent. Forty-one positions produce twelve categories of pigmentation. There is no ancestry estimate in that list and no face shape, stature or ear. The system was built to help identify unknown remains and to narrow a suspect list, and its authors present it as the first forensically validated tool for skin colour prediction rather than as a description of a person. The output is a set of probabilities over pigment categories, which is a long way from the sentence people type into a search bar.
How many markers buy what
The marker count is the honest measure of what any of these instruments can do, and the ladder is steep. Forty-one positions buy pigment categories. Parabon's Snapshot service genotypes a sample on an array reading 851,274 positions and from that predicts biogeographic ancestry, pigment, freckling and a face composite; the company describes the process as reading tens of thousands of variants from a sample. A consumer ancestry array reads several hundred thousand positions. A single copy of the human genome holds about 3.1 billion. Every rung returns more and costs more, and none is purchasable from a picture.
The ladder also explains why the composites look plausible and why plausibility is not evidence. A sample report states the defaults: the subject is depicted at roughly twenty-five years of age and an average body mass index, ear shape is not predicted at all, and the head shape is inferred from the predicted face shape instead of measured. The service's own terms describe the images as lead generation only, and instruct that they are not intended for use with facial recognition software. A statistical sketch, drawn from a genotype, declining to be treated as a photograph.
Identical genomes, distinguishable faces
The strongest argument against reversing the arrow is a pair of twins. Monozygotic twins share effectively the same genotype, and the faces of adult twins remain distinguishable, both to people and to software. The standard set for measuring this was assembled at the Twins Days festival in Twinsburg, Ohio, in August 2009 and again in August 2010, and holds 435 individuals across 24,050 images. Systems that clear 99 per cent on the LFW verification protocol land somewhere between the low seventies and high eighties on that set, depending on protocol and model. The gap is the part of a face the genome does not fix.
If one genotype can yield two distinguishable faces, then a face does not determine a genotype, and the map from sequence to appearance is not one-to-one. A mapping that is not one-to-one has no inverse: given the output, several inputs stay equally consistent, and a better model does not choose between them, because there is nothing in the output to choose with. That is a property of the relation rather than a limit of current software. The same argument runs the other way, since unrelated populations have arrived at similar appearances by different routes, and the catalogue notes those resemblances where observers saw them.
What the reverse would have to solve
Set the sizes side by side and the difficulty turns arithmetic rather than philosophical. A twelve-megapixel frame holds on the order of ten million samples of light. One copy of the genome holds about 3.1 billion positions. The comparison is not a fair accounting of information, because a picture of a face is a projection through skin, bone, fat and lighting onto two dimensions, and much of what it records is not genetic at all. What it does establish is that the picture is smaller than the thing it is asked to yield, and smaller in a lossy direction.
Then add the part that costs most. The visible traits are the ones with the largest environmental share: skin tone moves with ultraviolet dose, body mass moves with nutrition, and a face at fifty is not the face its genome specified at twenty. The defaults of age twenty-five and average body mass in a phenotyping report are an admission of this, since the model has to fix a body before it can draw one. A predictor that must assume a standard body is describing a conditional average, and a conditional average is precisely what a photograph cannot be inverted into.
Three questions wearing one phrase
People who search for DNA ancestry from a photo are usually asking one of three different things. Where did my family live, which is genealogy and belongs to records and to genotype matching. What am I, which is identity, built from language, family and community, and measured by no instrument on this page. Why do I look like this, which is a question about a phenotype and about a documented distribution. Only the first is a DNA question, and even it is answered against a reference panel rather than against a natural partition of humanity.
The catalogue's own text concedes how much mixture sits underneath. Of its 209 entries, 132 describe their pattern with mixture, admixture, contact or transitional language, and 107 use the plain words for mixture. Inuid is recorded as the result of a relatively late migration to America; Saharan Ethiopid was more common in the Neolithic, when the Sahara was green, and now runs from Chad to Niger; Twa-Cwa sits in the Congo forests as an intermediate between Bambutid and Congolesid; Botocudo was the dominant pattern of a people who declined sharply after European colonisation and survive as the Krenak, a few hundred strong. A catalogue built to sort types ends up documenting that the types leak.
What a photo can honestly support
What remains is not nothing. A face supports statements about documented appearance patterns, with a region, a date and a bibliography attached, and those statements can be checked against the sources that made them. That is what this catalogue is: 209 entries, each a proposal by an identifiable researcher, dated to a baseline of roughly 1,500 years ago, carrying 1,465 citations between them. None of it is a genotype and none of it claims to be, which is why the entries survive a change of method that would have invalidated a prediction.
Four questions separate a claim from a product. How many markers were read, and on what array. Which reference panels the model was trained against, and when those panels were collected. What error the published evaluation reports, and on which pool. And what the system returns for identical twins, since that one test exposes how much of an answer is genetics and how much is assumption. A service that can answer all four is doing measurement. One that answers none is charging for a silhouette.
Frequently Asked Questions
- Can a photo be used to get DNA ancestry?
- No. A photograph records reflected light and the shapes it falls on; a genotype is a readout of positions in a molecule. The genotype influences the photograph indirectly, through development, with losses at every step, so the route from picture back to sequence is not available. A tool that advertises the trick is either guessing from appearance, which is a weaker claim wearing stronger words, or describing what it would do with a sample nobody has provided.
- What can forensic DNA phenotyping actually predict?
- Pigment categories, mostly. HIrisPlex-S reads 41 positions and returns probabilities over three eye, four hair and five skin colour categories, and it was forensically validated in 2018. Commercial services add predicted ancestry and a face composite, built from arrays reading hundreds of thousands of positions. All of it starts with DNA and ends with a probability over categories or a statistical sketch, and the vendors themselves call the composites investigative leads rather than likenesses.
- Why do identical twins have different faces?
- Because a genome is a set of instructions acted on by development, not a blueprint with a fixed output. Twins accumulate different exposures, different injuries and different growth, and the soft tissue of a face records all of it. Recognition systems that clear 99 per cent on standard benchmarks drop sharply on a monozygotic twin set, which is a measurement of that difference. The result also settles the direction question: if one genotype yields two faces, a face cannot yield one genotype.
Related Phenotypes
Faces from the encyclopedia that appear in this article. Open any entry for its full description, distribution, and references.
Inuid
Arctic
Eskimid proper type, ranging over the vast, sparsely populated tundra along the icy coasts of Alaska, Nunavut, and Labrador (Canada) to Gree...
Botocudo
South America
Lagid subtype of the Mata Atlântica forests of Brazil, partially mixed with the Fuegid substratum (South Fuegids, Huarpids). Was the dominan...
Saharan Ethiopid
West Africa
Ethiopid type that was more common during the Neolithic when the Sahara was still green. Today it extends from Chad to Niger, Northern Niger...
Twa-Cwa
Sub-Saharan Africa
Pygmoid type of the Congo forests intermediate between Bambutid and Congolesid. Important groups in DR Congo are Mongo Cwa close to the Mai-...
Test what you learned
Put your eye for regional faces to work in the daily quiz — a composite face, a world map, and your best guess.