Ethnicity Quiz: Five Question Types Behind the Label
A face quiz, a census form, a reaction-time experiment, a surname model and an ancestry report all answer to the same phrase. What separates them is who supplies the answer, and what the answer format lets them say.
One label, five different instruments
Searching for an ethnicity quiz returns at least five unrelated instruments, and they disagree with one another by construction. One shows a face and asks a player to name a region. One asks a respondent to tick a box. One times how fast a viewer sorts photographs in a laboratory. One takes a surname and a postcode and returns a probability. One reads a DNA sample and prints a set of percentages. They share a name only because all five promise to say where a person stands, and they share nothing else: not an input, not a method, not a definition of being correct.
That gap matters more than any accuracy claim the five make. A quiz answered by a player measures familiarity with a catalogue of documented appearance patterns. A quiz answered by a respondent measures self-description. A quiz answered by a laboratory instrument measures the instrument. So the useful question is not whether an ethnicity quiz is accurate in general, because the standard of accuracy is never specified. It is who supplies the answer, and what the answer format allows that answer to be.
The map game and its forced choice
The modern map quiz has one clear ancestor. GeoGuessr was built by Anton Wallén, a Swedish IT consultant, and released in May 2013 as a browser experiment: five rounds, a pin dropped on a world map, up to 5,000 points per round and 25,000 for a flawless run, scored purely by distance. The template is durable because it removes every ambiguity except one. Face-based versions keep the pin, the distance and the scoreboard, and swap the street view for a portrait and the world map for a set of documented regional patterns.
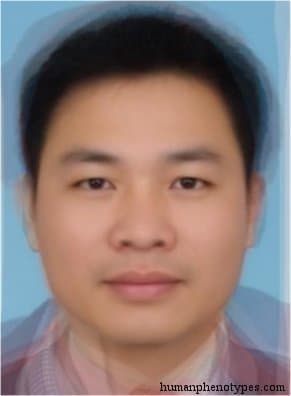
In the catalogue version, the pin becomes a named unit, and the unit names are mostly landforms and rivers rather than states. Chukiangid takes its name from the Chu Khang river in South China. Dalofaelid takes its name from the Swedish province of Dalarna. Appalacid takes its name from the Appalachian forests of eastern North America, and Shari from the Chari river in Chad. That naming habit does real work for a quiz: a river keeps its course while the states drawn across it are renamed or dissolved, so a catalogue built on physical features survives the political map that keeps changing underneath it.
The self-identification form
Here the respondent is the authority, and the instrument is a question list. The 2020 United States census recorded 49.9 million people in the Some Other Race alone-or-in-combination category, a 129 percent rise over the 2010 figure for that measure and enough to pass Black or African American at 46.9 million as the second-largest group counted that way. Census staff also logged roughly 55 million write-in responses in 2010 and about 350 million in 2020, after the form was changed to invite more detail. Those write-ins are the signature of a category list that failed to describe the people filling it in.
For anyone judging an ethnicity quiz, the census is a useful control case, because it is the largest such instrument in existence and it visibly measures the form as much as the person. The 2020 design change moved the reported distribution more than any migration pattern could have. A quiz that asks you to pick from eight categories and a quiz that asks you to write an answer do not return the same information, even when the same respondent sits in front of both.
The perception test in a laboratory
Psychologists have run a fourth kind of ethnicity quiz for decades: show observers a set of faces, then measure what the observers encode. Robert Kurzban, John Tooby and Leda Cosmides published a version of this in 2001 in the Proceedings of the National Academy of Sciences, volume 98, issue 26, pages 15387 to 15392. Their experiments found that sorting people by race was not compulsory. When the coalition cues built into the experiment stopped tracking visible appearance, subjects shifted the weight they gave to alliance over appearance, and in the second experiment the coalition effect size of 0.79 exceeded the race effect size of 0.49.
Less than four minutes of exposure to a social world where alliance and appearance no longer lined up was enough to reduce that sorting. The result belongs in a survey of quiz types because the score here is not a label at all. It is a reaction pattern, and it describes the viewer rather than the image. Photograph-based quizzes of every kind inherit that limit: the recorded value is what a person did with an image, not a property the image carries.
The surname and language quiz
The fifth instrument uses no face and no question at all. The Census Bureau's 2010 surname tabulation lists 162,253 surnames that occurred at least 100 times, and together those cover about 90 percent of people with a recorded surname; Smith alone accounts for 2,442,977 entries. On its own the list is a population table. Used naively it is the worst kind of quiz, because a name is assigned at birth and carries no dependable information about the person holding it.
Done carefully, it becomes a serious inference machine. Kosuke Imai and Kabir Khanna showed in Political Analysis in 2016, volume 24, number 2, pages 263 to 272, that Bayes's rule could combine that surname list with geocoded voter registration fields. Testing on roughly nine million Florida records, where self-reported ethnicity was already on file, they cut the false positive rate to 6 percent for Black voters and 3 percent for Latino voters while keeping the true positive rate above 80 percent. Every one of those numbers describes a group. None of them identifies a person.
The ancestry estimate as a scoreboard
A consumer ancestry report supplies a percentage breakdown, which makes it feel like the final quiz of the five. The arithmetic can be separated from the marketing. Any such number rests on two choices the customer never sees: which reference samples sit in the comparison set, and how many markers the panel reads. The Kidd laboratory panel at Yale uses 55 ancestry-informative single nucleotide polymorphisms and resolves up to ten biogeographic groupings, with allele frequencies for 164 population samples published through the laboratory's browser. Fifty-five markers cannot see detail that a larger panel would, and the printed percentage inherits that ceiling.
That is why the report reads like a scoreboard and still fails as a quiz. A quiz needs a correct answer to check against, and an ancestry estimate has none in reserve, because the reference panel defines which answers are available in the first place. Swap the panel and the percentages shift, without a single new genotype being read from the sample. The output is a comparison against a chosen set of populations, and it should be read as exactly that and nothing more.
Where all five lose their footing
The catalogue these quizzes draw on describes documented appearance patterns with historical distributions, at a baseline of roughly 1,500 years ago. Every one of the five instruments has to cross that gap to reach a living respondent, and they cross it with different amounts of strain. Self-identification forms capture current categories and not historical ones. Surname models decay fastest wherever names have travelled, because a name arrives with a family and not with a region. Ancestry estimates move with panel choice. Photograph-based quizzes strain least, and not because photographs read well, but because they make no claim about a person at all.
- Who supplies the answer: the player, the respondent, the observer, or a model reading a sample.
- What the answer format can express: a pin on a map, a box on a form, a reaction time, or a percentage.
- Whether the output is a claim about a person, or a statement about a reference set.
Frequently Asked Questions
- Is an ethnicity quiz the same thing as a DNA test?
- No, and the two are not close substitutes. A DNA test reads markers in a sample, compares them with a reference panel of population samples, and reports proportions. A face quiz codes visible features, or asks a player or a viewer to do so, and compares the result with a catalogue of documented appearance patterns. The DNA route draws on genetic data and the reference panel behind it; the face route draws on morphology and on whoever is doing the looking. Neither one reports an identity, and neither can stand in for the other.
- Why do different ethnicity quizzes give me different answers?
- Because they are different instruments answering different questions. A self-identification question records what you say about yourself and changes whenever the option list changes. A surname model returns a probability built from population tables. An ancestry estimate depends on the reference panel behind it. A map game scores how close your pin landed to a catalogued region. Four inputs, four outputs, and no shared standard, so disagreement is the expected result rather than a sign that one of them is lying.
- Can a face quiz tell me what I am?
- It cannot, and this site does not try. A catalogued pattern is a statistical tendency recorded in historical samples, not a category that a living person belongs to. Admixture and migration accumulated over the last fifteen centuries, so the map those entries were drawn on has moved underneath them. What a face quiz can do is teach you which features carry regional signal, how catalogue units were named, and how often confident guesses turn out wrong. Those are worthwhile things to learn about a method.
Related Phenotypes
Faces from the encyclopedia that appear in this article. Open any entry for its full description, distribution, and references.
Chukiangid
East Asia
South Sinid proper subvariety, named after the Chu Khang (Xi) river in South China. Developed in the fishing and gatherer populations of sou...
Dalofaelid
Northern Europe
Coarse, Cromagniform Nordid variety of Central and Northern Europe. Named after the Swedish province of Dalarna and the German region of Wes...
Appalacid
North America
Silvid subtype, native to the North American Atlantic forests, from the Great Lakes to the Appalachians. Shows some Europid traits, not only...
Shari
East Africa
Special type named after the Chari river of Chad. Intermediate between Sudanid and Nilotid, but with several unique features that have long ...
Test what you learned
Put your eye for regional faces to work in the daily quiz — a composite face, a world map, and your best guess.