Phenotype Scan: What the Entries Were Measured With
A scan returns a surface, and each entry in the catalogue is the output of a method rather than a picture of a face, and the difference is measurable. Where the cephalic index came from, and why a ratio is not an entry.
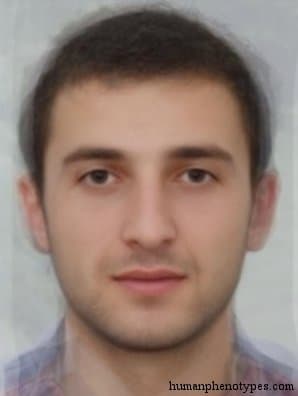
A scan returns a surface
A three-dimensional scan of a head produces geometry: a cloud of points, a mesh, a colour map laid over it. Every one of those outputs is continuous. There is no threshold anywhere in the file that says where one shape ends and another begins, and no field in it that carries a name. Ask a scanner what it has recorded and the honest answer is a description of one surface at one moment, under one set of lighting conditions, from one angle. That is a real and useful record of an individual, and it is not a category.
A catalogue entry is made of something else. It exists because somebody chose landmarks, chose an instrument, chose a set of comparison subjects and then wrote down what they saw. The surface is the raw material; the entry is the decision layered on top of it. That difference explains why two observers with the same photograph can produce different entries while a scanner pointed at the same head twice produces the same file. The instrument is repeatable, the judgement is not, and the old catalogues are made almost entirely of judgement.
The first shortcut was a ratio
The habit of compressing a head into one number began with Anders Retzius, professor of anatomy at the Karolinska Institute in Stockholm, who presented the cephalic index to a meeting of Scandinavian naturalists in 1842 in a lecture on the shape of Nordic skulls. The measure is simple arithmetic: take the greatest breadth of the skull, divide it by the greatest length from front to back, multiply by one hundred. Retzius then partitioned the results into long-headed, intermediate and short-headed classes, and the three names have outlived almost everything else he wrote.
The appeal was speed. One number let a collector compare a cranium from a Stockholm collection with one from anywhere else without describing either, and the ratio could be tabulated, sorted and mapped. It also let a single figure stand in for a whole head, which is precisely where the trouble starts. A quotient does not tell you what it was made from, so two skulls of very different size can share an index, and a reader who only sees the number has no way to find out. The shortcut survived because it made comparison cheap, not because it made comparison complete.
The manuals fixed the landmarks
For the index to mean the same thing in two laboratories, the endpoints had to be fixed. The 1884 Frankfurt agreement on craniometric measurement set a common reference plane and standard points, and it was argued over immediately; J. G. Garson published a critical discussion of it in the Journal of the Anthropological Institute the following year. Rudolf Martin's Lehrbuch der Anthropologie, published in Jena in 1914 with 460 figures in the text, turned those conventions into a working manual, and its table of contents alone shows the problem the discipline was trying to solve.
Martin divided the work into separate techniques rather than one. There is a section on somatometric technique, which is measuring with instruments, and a distinct section on somatoskopic technique, which is observing and grading what no instrument touches. The anthropometer, the sliding and spreading calipers and the drawing apparatus all appear in the earlier section with instructions for holding them. Aleš Hrdlička's Anthropometry, published by the Wistar Institute in 1920, did the same job for North American practice. The manual kept being revised after Martin's death, by Karl Saller among others, which is itself a sign of how much judgement had to be pinned down in writing.
An entry is a comparison to a series
The observational half of the method is where entries are actually made. An observer holds a described form in mind, looks at a living head, and slots it into a grade: this nose is leptorrhine, that vault is dolichocephalic, that brow is strongly developed. None of those words is a measurement. Each is a comparison to a reference series the observer was trained on, which is why the same head can be graded plainly by one worker and hesitantly by another. The type named in the entry is the modal form of the sample the observer was looking at, not a description of any person in it.
You can watch the convention at work in the entries themselves. The Mtebid record for the Caucasus notes that the type has the lowest nasal index of the whole region, which is a statement about a distribution of numbers rather than one head. The Maasai entry describes a pattern that is dolichocephalic and chamae-orthocranic with long, mildly leptorrhine noses. Read as labels, those words sound categorical. Read as the output of a grading protocol against a reference series, they say only that this form sat at a particular place in a comparison the observers had agreed to make.
A ratio hides the size it divides
Because the standard indices are quotients, they carry shape and discard magnitude. The Paleo Atlantid description of northern and western Europe records a very large-headed form that is dolichocephalic, sometimes mesocephalic. A small-headed form with the same proportions would produce the same index and a completely different head. Annamid, the gracile southern Sinid type of central Vietnam, is recorded as brachycephalic and hypsicranic in a body described as short and slightly built. The numbers say broad and high; they say nothing about how large.
This is not a flaw in the arithmetic so much as a reminder of what an index is for. It was designed to let one dimension be compared while the others were set aside, and every use of it inherits that decision. Size and shape vary independently, and the catalogue's vocabulary tracks shape almost entirely. A reader who wants to know whether a documented pattern was large-headed has to go back to the descriptive text, because the index they were given was never built to answer that question in the first place.
What multivariate reanalysis changed
The single ratio held the field until the numbers could be handled all at once. W. W. Howells published Cranial Variation in Man in 1973 as Papers of the Peabody Museum number 67, drawing on measurements taken from 28 recent samples from around the world, and returned to the material in Skull Shapes and the Map, published as paper 79 in 1989. Instead of comparing one index at a time, the analysis computed distances between samples across many measurements simultaneously, so a sample became a point in a space rather than a value on a scale.
What came back was a structure that tracks geography. Samples from nearby regions tend to sit near one another, and the ordering of the space broadly follows the map, which is why the catalogue's regional arrangement is not arbitrary. What did not come back was the old inventory. The named types of the typological literature do not fall out of a distance matrix one for one, with clean edges and stable counts. A ratio had handed readers a label; the multivariate view hands them a position, which is a less quotable result and a considerably more defensible one.
Reading a page instead of a surface
The catalogue's own dating is the last thing to hold on to. Entries are anchored to distributions reconstructed for roughly 1,500 years ago, which is a convention for the document as a whole rather than a date stamped on each page. Individual entries carry their own timelines. The Maasai record places a southward movement into Kenya and Tanzania beginning in the fifteenth century. The Chikuzen entry for northern Kyushu ties a Japanese pattern to a Neolithic horizon the compilers called Tsukumo. A reader who treats the whole catalogue as one instant will misread half of it.
The practical habit that follows is unglamorous. Read an entry as a document with an author, a region, a date and a list of references, and ask what the observers were comparing before you ask what they concluded. That is the difference between scanning a surface and reading a page. A scan returns one head at one moment and leaves the categories to somebody else. An entry returns a considered comparison made by named people in a stated year, which is why it can be checked, argued with and still used a century after it was written.
Frequently Asked Questions
- What is a phenotype scan actually recording?
- A scan of a face records geometry: points, surfaces and colour, all continuous and all specific to one individual at one moment. It contains no categories and no names. A catalogue entry is a different kind of object, produced when an observer chose landmarks, applied a grading protocol against a reference series and wrote down the result. The scan supplies raw shape; the entry supplies a comparison, an author and a date.
- Why did anthropologists rely on the cephalic index for so long?
- Because one number made comparison cheap. Anders Retzius proposed the cephalic index in 1842 as the greatest breadth of the skull divided by its greatest length, multiplied by one hundred, and the result could be tabulated across thousands of specimens without describing any of them. Its limits were built in from the start: as a ratio it discards absolute size, and the cut points that separate long-headed from short-headed were conventions that different authors drew in different places.
- Do the named types in the catalogue hold up scientifically?
- Less well than the measurements they were built on. When W. W. Howells analysed many cranial measurements at once across 28 worldwide samples, published by the Peabody Museum in 1973 and again in 1989, the samples arranged themselves along geographic lines. But the named types of the typological literature did not emerge one for one, with clean edges and stable counts. Treat the entries as documented historical descriptions of appearance patterns, not as divisions of the species.
Related Phenotypes
Faces from the encyclopedia that appear in this article. Open any entry for its full description, distribution, and references.
Mtebid
Caucasus
Regional type of the Caucasus Mountains. Probably an Alpinised Dinaro-Armenid adapted to life in mountainous regions. Mtebids are typical of...
Maasai
East Africa
Ancient South Ethiopid subtype, influenced by Nilo Hamitic and possibly Sandawe. Has probably been isolated in a remote region west of Lake ...
Annamid
Southeast Asia
South Sinid subvariety with less pronounced Sinid features that often tend to be very gracile. Typical for the old province of Annam in Viet...
Paleo Atlantid
Northern Europe
Ancient type that is sporadically found in Northern and Western Europe, usually only in relict populations. A resemblance with Cro-Magnons h...
Test what you learned
Put your eye for regional faces to work in the daily quiz — a composite face, a world map, and your best guess.