Photo Ethnicity Analyzer: Why the Same Few Labels Return
A photo ethnicity analyzer returns one name from a stored list, and the names nearest everything else come back far more often than their share.
The label that keeps returning
Two photographs arrive from people who have nothing in common except a haircut, and a photo ethnicity analyzer returns the same word for both. Read as a description of two faces, that looks like carelessness. Read as a description of the tool, it is arithmetic. The software does not reason about the person in the frame. It places the frame inside a fixed set of stored references and hands back the name attached to whichever reference sits closest. When the same few names keep surfacing across a wide range of faces, the cause usually sits in that stored set rather than in the faces.
What reaches the screen is one label with a percentage beside it, which conceals the fact that the tool has ranked the whole list and printed the top entry. Two things follow. An answer can only ever be a name that already has stored examples behind it, so the tool cannot report anything its reference set has never seen. And the frequency of each name is settled before any photograph is uploaded, because it depends on how the stored references sit relative to one another. The answer distribution is therefore a property of the set, describable without knowing anything about the people who use the page.
What the tool actually compares
The pipeline is short. A detector finds a face and crops a square around it; the crop is resized to a fixed input; a network returns a vector of a few hundred numbers; that vector is compared against every stored vector and the nearest one passes its label upward. Nothing in that sequence names a place. Place-names enter only because the stored set was labelled in advance by someone who decided which photographs belonged under which heading. Earlier systems learned embeddings of 128 numbers, later ones of 512, and the arithmetic is identical at either size: subtract, square, sum, take a root, sort. Most implementations also scale every vector to unit length first, which makes cosine similarity and Euclidean distance produce the same ranking, so the similarity being reported is really an angle between two arrows drawn from a shared origin.
Distances flatten as dimensions rise
In 1999 Kevin Beyer, Jonathan Goldstein, Raghu Ramakrishnan and Uri Shaft published a paper whose title reads like a provocation, When Is Nearest Neighbor Meaningful?, and their answer was that in high dimensional space it frequently is not. As dimensions accumulate, the distance to the farthest point closes on the distance to the nearest, and the contrast that a nearest-neighbour search depends on drains away. The effect is not a defect of one metric. It follows from the geometry, and it applies to any system that decides an answer by comparing distances in a long vector.
The flattening can be measured on data with no faces in it. Draw 600 points from a Gaussian distribution, compute every pairwise distance, and compare the ninetieth percentile against the tenth. In two dimensions the ratio is 4.68, wide enough to rank with confidence. At eight dimensions it falls to 1.96, at thirty-two to 1.38, at 128 to 1.17, and at 512 to 1.08. By the time a face is represented by five hundred numbers, every stored reference sits nearly the same distance from every query, and the gap between the leading candidate and the fourth is a few percent of the distance itself.
Some stored faces become hubs
Milos Radovanovic, Alexandros Nanopoulos and Mirjana Ivanovic named the consequence in a 2010 paper in the Journal of Machine Learning Research, volume 11, pages 2487 to 2531. They counted, for every point in a data set, how many other points list it among their k nearest neighbours, and showed that this count grows heavily skewed as dimensionality rises. A handful of points collect far more appearances than an even share would allow. They called those points hubs, and the skew is not a symptom of bad data; it follows from the shape of high dimensional distributions.
A simulation shows the size of the effect. With 1,500 points and ten neighbours each, the most popular point in two dimensions appears 17.6 times against an expected 10, and exactly one point in the set never appears at all. At 128 dimensions the most popular point appears 258 times, 316 of the 1,500 never appear in anyone's list, and the ten most popular points take 10.5 percent of all 15,000 slots, where an even distribution would give them 0.67 percent. At 512 dimensions the top ten take 11.9 percent and 391 points never appear.
Two limits belong with those figures. The points were drawn from a Gaussian, which is not how a face embedding is shaped, so the numbers describe a mechanism rather than any particular product. Whether a given analyzer behaves this way is a question about its own reference set, and it can be answered by uploading many faces and counting how often each label comes back.
The catalogue has its own middle
The catalogue this site publishes is not an even grid either, and several entries define themselves by position rather than by an extreme. Central Brachid is described as holding a morphological and geographical position between the West and East Indo Brachids. Assyroid is described as uniting Armenoid with Arabid features. Middle Nile is a contact type of the Nile Valley, characterised by a combination of Sudanid and Orientalid elements. Each description places its entry between named neighbours, which is precisely the position that accumulates nearest-neighbour traffic in a vector space.
Dinarid proper shows the same structure from the other direction. Its entry calls it the counterpart of the Alpinids, named for the Dinaric Alps and recorded from the Balkans through the Eastern Alps and the Carpathians, and the West Alpinid entry describes the Dinarid as a frequent cohabitant of the same mountain ground. Two labels, overlapping ranges, one landscape. A reference set assembled from entries of this kind would have an interior that the descriptions predict in advance, with the names defined by their neighbours returned for more queries than the names defined by a single trait at the edge of a range. That is a prediction about a hypothetical set, and it is testable.
Why the reference set ages
Two clocks run at once. The stored references are photographs taken in the past few decades, while the entries they are matched against describe distributions reconstructed for roughly 1,500 years ago. Between the two lie the movements that built the modern world, from the Atlantic trade through industrial urbanisation to a century of long distance migration, and the comparison runs straight across that gap. A label that fits a recent photograph and a distribution from the middle of the first millennium can both be accurate and still describe different centuries. Nothing in the interface marks where the seam falls.
The hub structure is not stable either. Adding one stored reference does not simply add one more option; it changes the distances among everything else, and it can create a hub or dissolve one. Re-crop the stored photographs, re-label a folder, remove the examples that were awkward to classify, and the names that recur will change with no edit to the code and no change in what users upload. A product keeps its name and quietly changes the distribution of its answers, so two comparisons taken months apart can be measuring different instruments.
Read the runner-up, not the winner
The output carries more information than the headline label suggests, provided the rest of the ranking is visible. A single word and a percentage are the compressed form of a sort that may have run over hundreds of candidates. Four questions reach the structure quickly, and each can be answered by looking at what the page displays rather than at what its marketing copy claims about accuracy.
A top label at 34 percent means the other 66 percent is spread across everything else, and on a list of a couple of hundred entries the second and third candidates are often within a point of the first. When that happens, the tool's own arithmetic does not support preferring the name it printed. What the page is really offering is a shortlist with a ranking inside it, and the honest version of the headline is that the reference set decided which few names were available before the photograph arrived.
- Ask for the first five entries rather than the first, and note the gap between them.
- Ask how many stored references sit behind each label, since a label with two examples cannot support a percentage.
- Ask what the page does when two references are equally close, because a tie is a design decision rather than an edge case.
- Upload many faces, count the labels that return, and compare those counts with the size of the list.
Frequently Asked Questions
- Why does a photo ethnicity analyzer return the same label for different faces?
- The label is not worked out from the face; it is inherited from the nearest stored reference, and in a high dimensional space a small number of references attract a disproportionate share of those nearest-neighbour relationships. The phenomenon is called hubness and it is documented in machine learning. A tool with a few hundred stored examples and a few hundred dimensions can therefore keep returning a handful of names across faces that share little. The repetition describes the reference set more than it describes the photographs.
- Does a higher percentage next to the label mean a better match?
- Not in any absolute sense. The figure is usually a normalised score across the whole label list, so it says how the top candidate compares with the others in that same list rather than how often such a match is correct in the world. When the leading candidates are close together, small differences in the crop or the light can reorder them. A reading of 40 percent and a reading of 38 percent should be treated as the same answer with a tie inside it.
- Can I test a tool for this problem myself?
- Yes, with patience rather than expertise. Submit a set of faces, record the label each one returns, and count how often each name appears. If a small group of names accounts for most of the answers, the behaviour described here is present in that tool. Two further questions sharpen the result: how many stored examples sit behind each label, and whether the page will show its top five rather than only the first. A tool that cannot answer either is reporting a rank it will not let you inspect.
Related Phenotypes
Faces from the encyclopedia that appear in this article. Open any entry for its full description, distribution, and references.
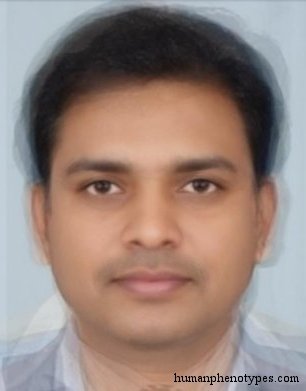
Central Brachid
Central Europe
Indo Brachid variety, with a morphological and geographical position between West and East (Indo) Brachids, but possibly resulting from diff...
Assyroid
Middle East
Semitic type that unites Armenoid with Arabid features. Historically important in the ancient Hittite Kingdom and the Assyrian civilisation....
Middle Nile
East Africa
The Middle Nile type is a contact type of the Nile Valley located in Northern Sudan. Features are variable, although North African, West Asi...
Dinarid (proper)
Southeastern Europe
Central European type typical for mountain and forest regions. Presents the counterpart of Alpinids. The name derives from the Dinaric Alps ...
Test what you learned
Put your eye for regional faces to work in the daily quiz — a composite face, a world map, and your best guess.