What Ethnicity Am I? Three Ways to Actually Answer It
The question is personal, but the answers arrive from three different places: records, DNA, and appearance. Each can tell you something real, and none of them is the same as an identity.
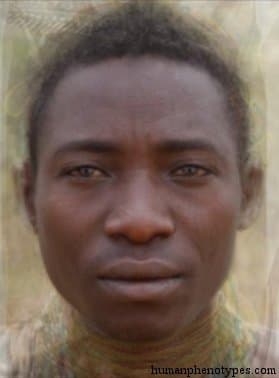
Three sources, three kinds of answer
The question is asked in the first person, which is part of why the answers keep feeling unsatisfying. "What ethnicity am I" is a request for a statement about descent, and there are only three places such a statement can come from. Documents and family testimony supply what was recorded. A DNA test supplies a statistical estimate built from genetic markers. Appearance supplies nothing at all, though it is the source the question reaches for first.
Keeping the three apart removes most of the confusion. A record can be incomplete or simply wrong, because borders moved, clerks guessed, and names were changed at ports of entry. A genetic estimate is a probability over reference panels, and its interval widens as the geography narrows. Appearance is a short list of visible traits, and the genes behind them are a small fraction of the genome. None of the three is a verdict on identity.
What a DNA test measures, and its edges
Consumer tests read several hundred thousand positions across the genome, with the commonly used arrays covering roughly 600,000 to 700,000 markers, and compare those against reference panels assembled from people whose geographic origins were documented. The output is a set of proportions over the panels, which is why the same person can receive different percentages from two companies. Change the panel and the answer changes, without a single base pair of the sample changing.
Within a continent the signal is real but coarse. Novembre and colleagues showed in 2008 that 3,192 Europeans genotyped at more than 500,000 markers fell onto a principal-component plot that roughly reconstructed the map of Europe, with about 90 percent of individuals landing within 700 kilometres of the place they reported being from. That is a striking result and still only a continental-scale one. The method loses resolution as the populations compared grow more similar, and uniparental markers, meaning mitochondrial DNA and the Y chromosome, each trace one line of descent rather than a whole ancestry.
Why a face cannot stand in for descent
The genes that drive visible variation are few, and they are not a random sample of the genome. A single region near HERC2 accounts for the majority of eye-colour variation in the European samples studied by Sturm and colleagues, with OCA2 alongside it. SLC24A5 carries a variant that explains a substantial share of the skin-colour difference between African and European samples, characterised by Lamason and colleagues in 2005. A 2021 study of about 169,000 people pushed the count of eye-colour-associated loci past 50, nearly all of them contributing small effects.
That architecture cuts both ways. It means appearance is heritable enough to form regional patterns, and it means those patterns are narrow. Height is the most studied visible trait and is roughly 80 percent heritable, yet the largest genetic analysis of it, the GIANT consortium's 2018 effort, needed more than 3,000 variants to account for only about a quarter of the variation. A trait with that many small contributors cannot be read backwards into a place of origin.
Four entries that show what a pattern is
The catalogue this site publishes exists to make that distinction concrete rather than abstract. Its 209 entries describe appearance patterns documented at a place and a period, with the source literature cited alongside each one, and a number of them are marked as long-isolated relict types, meaning patterns recorded in narrow pockets rather than across a whole continent.
Hadza covers a pattern catalogued among the Tanzanian Bushmen near Lake Eyasi, described as very distinct from any other and long isolated, and confined to a population of fewer than 800. Aoshima is the Ainuid type of Japan, compared in the source material to Jomon populations and described as surviving in the Ainu of Hokkaido into the twentieth century before admixture and assimilation reduced it. Chocó-Motilon, from Colombia, Venezuela and Panama, is recorded as carrying Brasilid elements together with traces of one of the earliest migrations into South America. North Australid describes the pattern of northern and central Australia, typical of the Gulf of Carpentaria and catalogued as similar in some respects to Paleo Melanesids.
The labels do not hold still
Read those four entries next to the person asking "what ethnicity am I" and the mismatch is obvious. Each describes a distribution observed in a specific region, often in small numbers, at a documented period. None is a category a living person belongs to. The Chocó-Motilon entry, for instance, is catalogued as carrying traces of two distinct early migrations, and the Hadza entry as confined to a population of under a thousand; a pattern with a place and a date is not a label with an owner.
Population genetics does not hand down a fixed roster of groups either. Rosenberg and colleagues showed in 2002 that a clustering program run on 377 microsatellite markers from 1,056 people recovered five groups that lined up broadly with continents, and that the same analysis kept finding further structure as the number of clusters was raised. Continuous variation behaves that way. How many groups to report is a decision an analyst makes, not a fact the genome supplies.
What changed after the baseline
The catalogue's baseline sits roughly 1,500 years back, and everything after it rearranged populations faster than the centuries before it. Bantu-speaking expansion was already underway at that date and continued pushing south for another thousand years. Forced migration then crossed oceans, and the indenture system alone carried well over a million Indians to Mauritius, the Caribbean, Fiji and Natal between the 1830s and 1920. Post-war labour recruitment reshaped parts of Western Europe within a single generation.
The people living in a catalogued region today are therefore usually mixtures the catalogue never claimed to describe. Classification systems have shifted too. The United States census, which permitted only one race answer until 2000, counted 33.8 million people reporting more than one race in 2020, up from 9 million a decade earlier. An entry remains a claim about a distribution at a period, and the further you stand from that period, the less the map predicts what you will actually see.
How to get a useful answer
If the goal is a genuinely informative answer rather than a quiz result, the sequence that works is unglamorous. Start with documents and living relatives, because a paper trail is cheaper and more precise than a genotype for the last few generations. Then, if the deeper signal interests you, take a test and read the confidence intervals rather than the headline percentages, and consider uploading the raw data to a second service to see where the two disagree. The disagreements are the informative part.
Appearance belongs at the end of that list, as something to describe rather than to decode. A composite face from the catalogue is a record of a documented pattern, useful for seeing how one regional average differs from a neighbouring one, and useless as evidence about a person. Playing the game with that framing is how it stays enjoyable: the skill under test is geographic reasoning, not the ability to read ancestry off a face.
Frequently Asked Questions
- Is there a test that will tell me what ethnicity I am?
- Not in the sense the question usually means. Consumer DNA tests estimate proportions over reference panels, showing how much of your markers resemble each panel, and those proportions shift whenever a company changes its reference set. They describe genetic similarity to documented populations rather than an identity, and they do not settle nationality, culture or belonging. A test can be a genuinely useful input, but it is not an authority on who you are.
- Why do two DNA companies give me different results?
- Because each compares your markers against its own reference panel, built from people whose origins were recorded in a particular way. Different panels, different geography, different percentages. Array coverage differs too, commonly between roughly 600,000 and 700,000 markers, though the panel matters more than the marker count. The disagreements are usually informative rather than alarming, and they tend to shrink when both results are grouped at a continental scale.
- Can appearance tell me anything about my ancestry?
- A little, in a coarse and unreliable way. Visible traits are driven by a modest number of genes, and those genes hold no record of where your ancestors lived. A 2021 study of about 169,000 people linked more than 50 gene regions to eye colour alone, most with tiny effects. That brings regional averages into existence, which is what the catalogue documents, but it cannot rank an individual against them or recover anyone's descent.
Related Phenotypes
Faces from the encyclopedia that appear in this article. Open any entry for its full description, distribution, and references.
Hadza
East Africa
Ancient type of the Tanzanian Bushmen, living close to Lake Eyasi. Very distinct from any other type in the world and has probably long been...
Aoshima
East Asia
Ainuid proper, the most ancient type of Japan. Resembles Paleolithic Japanese populations like the Jomon people. Probably a relict of an old...
Chocó-Motilon
South America
Special type found in Colombia, Venezuela, as well as Panama. Contains Brasilid elements as well as relicts of one of the first migrations t...
North Australid
Australia
Australid type of Northern and Central Australia typical for the Gulf of Carpentaria. Shows some similarities to Paleo Melanesids. By some a...
Test what you learned
Put your eye for regional faces to work in the daily quiz — a composite face, a world map, and your best guess.