What Ethnicity Do I Look Like? What a Face Can and Cannot Tell
The question assumes a face carries an ethnicity label. What it carries is a set of trait distributions that overlap heavily between regions, which is why an honest answer is about uncertainty rather than identity.
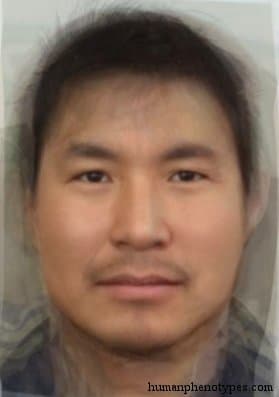
The question has no lookup table
People ask it expecting a label, and the honest answer is that no lookup table exists. Faces vary continuously. The traits observers actually read, among them pigmentation, hair form, eye shape, and nasal breadth, each follow a distribution, and those distributions overlap so heavily between regions that a single face usually falls inside the range of many places at once. Nasal index alone spans a broad band in every large region ever measured, which is why the same photograph can be sorted into different groups by different observers without either sorting being obviously mistaken.
What observers match against is a set of learned prototypes rather than a measured distribution. Research on the other-race effect, summarised in a 2001 meta-analysis by Meissner and Brigham, shows that people classify and remember faces from familiar groups more fluently than faces from unfamiliar ones. That fluency feels like recognition of a fact about the face in front of them. It is closer to recognition of a category the observer already carries, which is a different thing entirely.
What actually varies, and what the genes say
The visible traits that drive these judgments rest on a modest number of genes with large effects. SLC24A5, identified by Rebecca Lamason and colleagues in 2005, accounts for a substantial share of the pigmentation difference between European and African populations and approaches fixation in Europe. HERC2 and OCA2 variants explain much of the variation in eye colour, as work published by Eiberg and colleagues in 2008 established. MC1R variants underlie red hair, described by Valverde and colleagues in 1995. A handful of large-effect variants, not a fixed package, is what the visible differences come down to.
Hair and body form follow the same pattern. EDAR V370A, dated by Kamberov and colleagues in 2013 to roughly 30,000 years ago, is associated with thicker hair shafts, denser eccrine glands, and incisor shape in East Asian populations. TCHH variants influence whether hair is straight or curly. Because these genes assort independently and each carries its own distribution, trait combinations do not travel as bundles. A person can carry variants for thick straight hair and for light eyes without belonging closely to any single pattern recorded in a catalogue.
The categories in the question
The wording also hides a choice. Does it mean nationality, which is a legal status that changes when borders change? Ancestry, which is a statement about genealogy? Appearance, which is what a photograph happens to capture? Or a racial category, which the biological literature has largely abandoned as a way of classifying people? Each framing comes with its own evidence and its own scale, and the answer moves when the frame moves. A nationality is granted by a state and can be acquired or lost without any change to a person's face, while ancestry is a genealogy that need not correspond to either appearance or citizenship. Asking which of the three a face displays mixes questions that have separate answers.
Lewontin's 1972 survey put roughly 85% of human genetic variation inside populations rather than between them, and Livingstone argued in 1962 that the variation is clinal rather than divided into kinds. Genetic clustering can still recover continent-level structure, but the number of clusters is a choice made by the analyst, and the clusters describe reference samples rather than individuals. That is why one face can be sorted into several categories with equal apparent confidence.
What a documented catalogue can tell you
A phenotype catalogue answers a different question: which appearance patterns have been described, where, and by whom. Inuid is recorded along the icy coasts of Alaska, Nunavut, Labrador, and Greenland, described as the northernmost phenotype in the world and the product of extreme Arctic adaptation. Annamid is a gracile South Sinid subvariety associated with the old province of Annam in Vietnam, described as forming through Sinid expansion southward and the assimilation of earlier populations. Central Ethiopid is documented in the central Ethiopian highlands, in its most characteristic form among Oromo communities.
Bororo is the northernmost Patagonid variety, recorded in western Bolivia and the Brazilian state of Mato Grosso. Entries like these are historical records with citations, and they are useful for understanding how earlier researchers grouped what they observed, including the places where their categories were arbitrary. What they are not is a mirror. An entry describes a sample documented in a particular decade, it makes no claim about anyone reading it now, and appearance is not ancestry.
Why a 1500-year-old map cannot read your face
The catalogue's baseline sits roughly 1,500 years in the past, and the centuries since then moved people on a scale the earlier researchers could not have watched closely. Enslavement carried more than twelve million Africans across the Atlantic and millions more across the Indian Ocean. Steppe incursions, Roman-era resettlement, Silk Road exchange, industrial urbanisation, and the wars of the twentieth century each added a further redistribution. Aviation then compressed the timescale, moving people between continents within a single day.
So the map is a snapshot with a date attached, not a picture of the present. Many people now combine traits from several documented patterns, and some match none of them closely. That outcome is not an anomaly or a gap in the record. It is the predictable result of several centuries of large-scale movement layered on top of an older distribution. Read that way, the catalogue records where patterns were documented at a particular moment in the past rather than where they are found today, and it was never designed to settle questions about people living now.
Making the question answerable
What can be answered is narrower and more interesting. Which documented patterns does a given set of traits resemble, and how much do those patterns overlap? Which reference samples are involved, and how large are they? How wide is the uncertainty on the estimate? Ancestry estimation addresses a version of these questions using marker data and reports intervals alongside its proportions. A quiz measures whether you can recognise described regional patterns, which is a skill rather than an identity.
The urge to convert a resemblance into a verdict is understandable, and it is the point at which the tools stop being informative. A face supplies weak evidence about a distribution and no evidence at all about someone's legal status, family history, or sense of self. Treating the question as a statistical one keeps it honest. Answering it with a label turns a rough inference into a claim the data cannot support.
Frequently Asked Questions
- Can anyone tell what ethnicity I am from a photo?
- Not reliably, and the attempt confuses two different things. Appearance traits overlap heavily between regions, so a photograph narrows the possibilities far less than it feels like it should. Ancestry is a statement about genealogy, inferred from genetic markers compared against reference panels, with intervals attached. Someone reading a face is matching it against learned prototypes, which varies with who is looking. No photograph carries a definitive answer about ancestry.
- Why are ethnicity guesser results so different between tools?
- Because each tool fixes a different frame. A classifier returns one of the labels it was trained on, an ancestry service reports similarity to whichever reference panels it holds, and a historical catalogue describes patterns documented in earlier literature. Where trait distributions overlap, small changes in frame shift the answer. Disagreement between tools is the expected outcome rather than a sign that one of them is broken.
- Is there a useful way to explore where my appearance patterns come from?
- Yes, as long as the question stays historical and statistical. Population genetics literature describes how traits such as pigmentation and hair form are distributed and which variants influence them, and ancestry estimation reports marker-based similarity to reference panels with stated uncertainty. A documented phenotype catalogue adds context about patterns recorded in earlier literature. None of these returns a single label, and appearance remains a poor substitute for ancestry even when the two loosely agree.
Related Phenotypes
Faces from the encyclopedia that appear in this article. Open any entry for its full description, distribution, and references.
Inuid
Arctic
Eskimid proper type, ranging over the vast, sparsely populated tundra along the icy coasts of Alaska, Nunavut, and Labrador (Canada) to Gree...
Annamid
East Asia
South Sinid subvariety with less pronounced Sinid features that often tend to be very gracile. Typical for the old province of Annam in Viet...
Central Ethiopid
East Africa
Ethiopid subtype of the central Ethiopian highlands and their surroundings. Found in its purest form among Oromos. Also in other Cushitic sp...
Bororo
South America
The northernmost Patagonid variety, often mixed with local Lagid elements, but with a variety of unique features. Native to the savannah and...
Test what you learned
Put your eye for regional faces to work in the daily quiz — a composite face, a world map, and your best guess.