Average Face of China: Five Rows for 1.4 Billion People
An average face of China has to average either a territory or a population, and the catalogue's five mainland rows are weighted by neither.
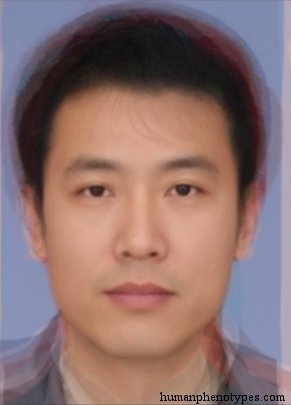
Two things can be averaged
An average face of China is arithmetic, and the arithmetic needs a sample before it can begin. The sample can be a territory or a population, and the two do not agree. As a territory the country runs from about 18 degrees north on Hainan to 53.5 at Mohe, and roughly 62 degrees of longitude from the Pamir to the Ussuri, across some 9.6 million square kilometres. As a population it was 1,411,778,724 people at the 2020 census. Averaging the map gives weight to the Taklamakan and the Changtang; averaging the people gives weight to the North China Plain.
The catalogue this site publishes makes that choice visible, because its entries are counted in rows rather than in people. Eleven rows are filed under East Asia. Six of them describe Japanese subvarieties: Aoshima, Ishikawa, Chikuzen, Satsuma, Choshiu and Yakonin. Five cover the mainland: Huanghoid, Changkiangid, Chukiangid, Kham and Manchu-Korean. Five rows for 1.4 billion people, and six for a country of 125 million. That ratio records where the measuring expeditions went, and it belongs to a history of scholarship rather than to a claim about anybody's face.
The division follows two rivers
Two of the five rows are named after rivers, and both were defined and named by Liu in 1937. Huanghoid takes its name from the Huang Ho and is described as a North Sinid type developed from loess and millet farmers, typical in Liaoning, Kirin, Heilungkiang and Jehol. Changkiangid takes the Yangtze and is described as developed from river and rice farmers, typical from Kiangsu across to Yunnan, and the record calls it today the most populous human variety in the world. Their pins sit 1,606 kilometres apart, at 35.08 north 97.94 east and 30.56 north 114.29 east.
The pairing is an archaeological claim as much as an anatomical one. Millet farming in the Yellow River basin and rice farming in the Yangtze basin are separate domestications, both older than 7,000 years, and they produced different settlement patterns, different pottery and different diets long before they produced any shared political frame. A national composite averages the two centres of domestication into one image, and the image belongs to neither. What it shows is the midpoint of a gradient that the entries themselves cut in two.
The plateau keeps its own row
Kham is a third kind of entry, and it resists being averaged into the other two. The record describes it as a robust Sinid variety concentrated in eastern Tibet among nomads and warrior castes, and spread through southern Tibet, Qinghai, Gansu, Sichuan, Yunnan, northern Burma and Arunachal Pradesh. It then adds a sentence that is unusually candid for this literature: Kham could be an older Sinid type, or it could be an adaptation to high altitude, and the record does not decide. Turner in 1913, Morant in 1924 and Montandon in 1933 all worked the same material. Its pin sits at 30.60 north, 96.84 east.
Altitude is why the row cannot be folded away. A composite weighted by land area puts most of its weight on the western half of the country, much of it above 4,000 metres and almost empty of people. The five mainland pins average to 33.01 north, 109.78 east, in the Qinling. An area-weighted centre falls nearer 35 north, 103 east, in Gansu, 663 kilometres away, and the population centre sits roughly 900 kilometres east of that. A face averaged by territory describes a place where density runs to a few people per square kilometre.
A line drawn in 1935 still holds
In 1935 Hu Huanyong plotted more than twenty thousand points on a map, one for every 20,000 people, and drew the line that now carries his name from Aihui to Tengchong. East of it lay 36 percent of the land and 96 percent of the population at the time. After the postwar boundary changes the eastern share of the land rose to about 43 percent, holding roughly 94 percent of the people. The 2010 census put 93.68 percent of the population east of the line, and the 2020 count came in close to 93.5. Eighty-five years of industrialisation moved the figure by less than a percentage point.
For a photographic composite the line matters more than any border. An archive is a population sample, so about 94 percent of the faces in a national average come from 43 percent of the ground, and that eastern half is itself cut in two by the Qinling-Huaihe line running west from the coast near the Huai. The second division separates wheat from rice and heated housing from unheated, and it falls close to where the Huanghoid and Changkiangid descriptions meet. A single national average flattens both lines at once, which is why it can look plausible and still describe nobody in particular.
The northeastern row is emptying
Manchu-Korean is the fifth mainland row and the one with the longest reach, since its description runs from Manchuria through North China into central and north Korea, with a Japanese subvariety around Kyoto. Baelz defined the name in 1901, and later authors kept it while others renamed the same material Korean. Its pin, at 45.76 north and 126.63 east, is 3,073 kilometres from the Kham pin, the widest gap between any two of the five. Whatever a national average is, it has to span that distance and the climate gradient that comes with it.
The provinces the entry calls typical are also the ones losing people fastest. Between the 2010 and 2020 censuses Heilongjiang fell from 38,312,224 to 31,850,088, a loss of 6,463,903 or 16.87 percent, the steepest decline of any province. Jilin fell 12.31 percent and Liaoning 2.64 percent. The three together went from about 109.5 million to 98.5 million, down 11.01 million or 10.04 percent, and their share of the national population fell from 8.18 to 6.98 percent. An archive assembled now samples a thinner version of the distribution the 1901 description recorded.
What the ancient genomes add
Genetics gives a separate account of why the north and the south differ, and it produces a gradient rather than a set of boxes. Yang and colleagues sequenced 26 individuals from northern and southern East Asia spanning 9,500 to 300 years before present, published in Science in 2020, and found that genetic differentiation in the region was higher in the past than it is now. The difference was reduced by a major episode of admixture in which northern East Asian ancestry spread across the south after the Neolithic, transforming the ancestry of southern China. The same paper ties Neolithic southern mainland groups to the later Austronesian expansion.
Two consequences follow for anyone averaging faces. The first is that the north-south difference is real as a cline and was steeper before the spread, so the entries that halve the mainland are describing a real gradient with an arbitrary cut placed in it. The second is that a cline has no natural number of categories: five rows and eleven rows are both defensible, which is exactly why a count of rows cannot be a count of kinds. The old argument that human variation forms clines rather than races applies inside a single country as much as across a continent.
What an average of China can be asked
It can be asked what a stated sample averages to. It cannot be asked what China looks like, because the answer moves with the sampling frame, and because two of the five rows are named for rivers, one for a highland people, one for a pair of peoples and one for the peninsula at the mouth of a third river. Those names are a record of how the grid was built: by observers travelling where institutions let them travel and measuring where a clinic, a school or a garrison produced a queue. The density of rows follows the itinerary, not the census.
The useful version of the question is narrower and testable. Given this archive, this date and this set of rows, what is the mean face of the sample? That version can be rebuilt, argued with and corrected, and it asks nobody to accept a claim about who counts as Chinese. The entry pages do the work the composite cannot, since each records the specific traits, the researcher and year behind it, and the region it was assigned to. None of them names a living person, and none ranks one pattern against another.
Frequently Asked Questions
- Why does an average face of China look unlike most people in China?
- Because the image is a mean over a sample, and a mean keeps the centre while discarding the spread. Build the sample from provincial identity photographs and you get one face; build it from a broad age range, or from a city where internal migrants outnumber locals, and the mean shifts. The composite also inherits the settlement pattern: roughly 94 percent of the population lives on 43 percent of the land, so a national average is close to an eastern average with a thin western tail.
- Does the catalogue have a single entry for China?
- No. The 209 entries carry no row called China. The mainland is covered instead by five East Asian rows: Huanghoid for the northern river basin, Changkiangid for the central and southern river basin, Chukiangid for the southeast coast, Kham for the eastern Tibetan plateau, and Manchu-Korean for the northeast and the peninsula. That plurality is the point. A single national label merges five descriptions that the literature kept apart, and each of them names a different region and a different set of observers.
- Is an average face the same thing as a national look?
- No. A national look is a claim about a population, while an average face is a statement about a file of photographs: this archive, this date, this registration standard. The two diverge as soon as the archive is unrepresentative, which it usually is, since identity photography skews toward whoever holds a card and stands in front of the camera. Treating the composite as a locator for the catalogue's own rows is defensible. Treating it as a verdict on a person is not.
Related Phenotypes
Faces from the encyclopedia that appear in this article. Open any entry for its full description, distribution, and references.
Huanghoid
East Asia
North Sinid type, named after the Huang Ho (Yellow) river in Northern China. Developed from loess and millet farmers. Usually regarded as th...
Changkiangid
East Asia
Sinid subtype, named after the Chang Kiang (Yangtze) river in Central China. Today the most populous human variety in the world. Developed f...
Kham
East Asia
Robust Sinid variety, found in its highest concentration in Eastern Tibet, especially in the Kham region in nomads and warrior castes. Could...
Manchu-Korean
East Asia
North Sinid subtype, significantly influenced by Tungid. Typified by Manchu and Koreans. Most common in Manchuria / North China, and Central...
Test what you learned
Put your eye for regional faces to work in the daily quiz — a composite face, a world map, and your best guess.