Average Face of Japan: What the Composite Contains
A national composite is a mean, not a portrait. Reading the Japan entry against the six Japanese patterns in the catalogue shows how much internal range a single average hides, and why the sample decides the result.
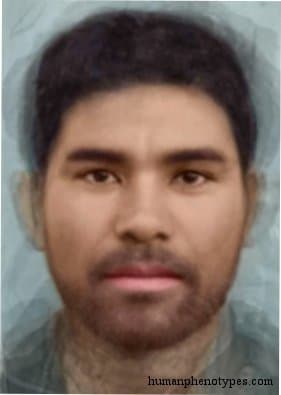
What a National Average Actually Is
A composite face is an average, computed landmark by landmark across many portraits, and an average keeps the mean while discarding the spread. If the people photographed differ by 40 millimetres in nose length, the composite shows the middle of that range and nothing about either end of it. A national composite is therefore one summary statistic: a single point standing for a distribution, accurate as a centre and useless as a description of anyone at the edges.
Japan appears on this site as one of 48 country pages, built by the same procedure as the rest. That is a deliberate limitation rather than a claim about a nation. An average face of Japan is a portrait of a sample, and the sample decides what the composite looks like: shift the sampling frame and the mean moves, often by more than the visible difference between the centres of two neighbouring countries.
Six Japanese Patterns in the Catalogue
The 209 entries include several filed under East Asia that the typological literature described inside Japan. Aoshima is the oldest element in that material, recorded among the Ainu of Hokkaido and read as a relict of the Jomon period; Matsumura named it, and Montandon in 1927 and Koya in 1937 produced the detailed descriptions later authors borrowed. Ishikawa, named by Hasebe and Matsumura, was placed in the northern middle and north-eastern parts of Honshu, with notes on a short face and weakly prominent cheekbones.
Further south the catalogue records Chikuzen, named after the old province that now sits inside Fukuoka Prefecture and described as most common in the northern half of Kyushu, with a note that it was often reported among samurai. Satsuma takes its name from the Kagoshima region and is described along the southern coasts of Kagoshima, Shikoku and Honshu, in the Ryukyu Islands and on Korea's south coast. Choshiu, from the old Choshu domain, is placed on the west coast of Honshu and read as a gracile version of the Manchu-Korean pattern.
Yakonin is the outlier. Its name comes from the Japanese word for a bureaucrat, Weisbach proposed it in 1878, and Klenke reported it in about six percent of a 1938 sample of Japanese Olympic athletes. Six named patterns, one country, and their described centres sit hundreds of kilometres apart: the north of Honshu, northern Kyushu, the southern coast and the west.
The Distance Those Patterns Span
Japan runs about 2,800 kilometres from the Okinawa chain in the south-west to Cape Soya at the northern tip of Hokkaido, and the main island of Honshu is roughly 1,300 kilometres long. Kagoshima, the centre named for Satsuma, and Wakkanai, near the top of Hokkaido, sit something over 1,500 kilometres apart, a distance comparable to Oslo to Rome. The latitude band shifts with them, from about 26 degrees north in the Ryukyus to 45 degrees north in the far north.
Longitude compresses as latitude rises. A degree of longitude measures close to 100 kilometres at 26 degrees north and about 81 kilometres at 43 degrees north, so a composite drawn onto the usual web map is stretched by a factor near 1/cos(latitude) and cannot be read as a to-scale picture of the archipelago. An average taken across the full span of the country is a mean over a climate gradient reaching from subtropical islands to cold-temperate coast, and it flattens that gradient into one face.
What the Ancient Genomes Add
Genetics gives a second and independent account of why the north and the south differ. A 2019 study led by Kanzawa-Kiriyama sequenced a Jomon individual from the Funadomari site on Rebun Island and found a lineage deeply divergent from later mainland East Asian groups. In 2021 Cooke and colleagues published genomes from the Kofun period and argued for three ancestral contributions to the modern Japanese population, with Jomon-related ancestry strongest in Ainu and Ryukyuan groups and more diluted on the main islands.
Those results describe population history, and they do not translate into a face. Two people with similar ancestry estimates can look quite different, and the proportions vary within families as much as between regions. What the genomes explain is why one national composite cannot hold both ends of the country at once: the gradient they measure is the same gradient the portrait averages away.
Why the Sample Decides the Answer
Composites are usually built from modern photographs, so the average ages along with the archive it was drawn from. The catalogue's own baseline sits roughly 1,500 years back, and between that baseline and a photograph taken this year lie the urban growth of the Edo period, the population shifts after 1868 and after 1945, and a twentieth-century movement into the Tokyo, Osaka and Nagoya corridors that left the Tokyo metropolitan area holding about 30 percent of the country.
A composite assembled from web photographs will skew urban, young and self-selecting, because those are the faces that get uploaded. Japan's population passed 100 million in 1967 and peaked near 128 million in 2008 before declining, a trajectory that emptied many of the rural districts where several of these patterns were first described. The average face of Japan returned by a tool in 2026 is an average of a sample that did not exist when the catalogue was compiled.
What a National Average Cannot Say
An average face of Japan cannot tell you anyone's nationality, and it cannot decide whether a person is Japanese. Nationality is a legal status, and appearance varies more widely inside any country than between the centres of two neighbouring ones. The composite also carries no ranking: nothing in the method supports a claim that one national average is more distinctive, more typical or better looking than another, because averaging supplies no scale on which such a claim could be read.
Reading it well means treating it as a locator rather than a description. It answers the question of where a set of documented patterns sits on a map. For anything finer, the entry pages do the work the composite cannot, since each one records the specific traits, the literature it came from and the researcher who described the pattern, along with the exact region it was assigned to. Those entries are the level at which the catalogue actually operates.
How to Use the Composite Honestly
A useful test is to ask what the image would look like if the sample changed. Draw only from Kagoshima and the result shifts south; draw only from Aomori and it shifts north; draw from Tokyo commuters and it shifts young and urban. Every version is still an average of Japan in some defensible sense, which is the point worth holding on to: the picture is a function of a sampling decision, and a figure that moves that much under a reasonable change of sample should not be quoted as a fact about a country.
There is still a good reason to keep the composite in view. It gives a player a first anchor for a region, and it makes the clinal argument visible, that faces shade into one another across distance instead of stopping at a border. Used that way, an average portrait is a teaching object. Used as a verdict on a person, it is simply the wrong instrument.
Frequently Asked Questions
- Is the average face of Japan a real person?
- No. It is a composite: many portraits aligned on landmarks and averaged, so the result is a synthesised image rather than a photograph of anyone. The method keeps the mean position of each feature and removes individual variation, which is why composites tend to look symmetrical and slightly unfamiliar. The image should be read as a summary of a sample, in the same way a national median income describes a distribution rather than a household.
- Why do different sources show different Japanese average faces?
- Because they average different photographs. A composite built from students in one city, a set of scraped web portraits and a national survey sample will produce three visibly different images, and the method adds a second source of variation through alignment choices and how faces are normalised before averaging. The gap between those three is usually larger than the gap between two neighbouring countries' averages, which is the clearest sign that sampling is doing much of the work.
- Does an average face mean everyone in Japan looks similar?
- No, and the arithmetic says the opposite. Averaging removes variation rather than reporting it, so a composite can be smooth while the underlying population is diverse, and the spread inside one country exceeds the distance between the centres of most neighbouring ones. Appearance also shifts with age, health, diet and ancestry in ways no national composite captures. Treat the image as a coordinate for one set of documented patterns, not as a description of the people who live there.
Related Phenotypes
Faces from the encyclopedia that appear in this article. Open any entry for its full description, distribution, and references.
Aoshima
East Asia
Ainuid proper, the most ancient type of Japan. Resembles Paleolithic Japanese populations like the Jomon people. Probably a relict of an old...
Chikuzen
East Asia
Special Japanese type, influenced by ancient regional elements. Named after the old Chikuzen province that is today part of Fukuoka Prefectu...
Choshiu
East Asia
Gracilised variant of the Manchu-Korean type, named after the old Japanese Choshu Domain. Once common in Chinese-Korean aristocracy. Today m...
Satsuma
East Asia
South Mongolid type of Japan and Korea, somewhat influenced by Tungid. Named after the Satsuma region of Kagoshima. Today the most populous ...
Test what you learned
Put your eye for regional faces to work in the daily quiz — a composite face, a world map, and your best guess.