Best AI Ethnicity Guesser: What a Ranking Can and Cannot Show
A best-of list for face analysis tools hides four decisions: the property that counts, its weight, the photographs tested, and who paid for the list. Here is how to score one yourself, and what the list hides.
A ranking needs four stated parts
Every list that names one tool the best has already settled four questions: which property counts, how much that property weighs, which photographs were used, and who paid for the page. A page that answers none of them has published a preference in the grammar of a measurement. The grammar matters, because a reader choosing a tool for a school project and a reader running one on a family photograph need different properties. The same five products can be ordered two ways without any product changing.
Valerie Belton and Tom Gear showed how easily that order moves, in a two-criterion example published in Omega in 1983. Three options scored 9 on the first criterion and 1 on the second, the reverse, and 1 on both. With equal weights the order came out second, first, third. They then added a fourth option that copied the winner exactly, and the first option took the lead while the two copies tied behind it. Nothing about the original three had changed. The paper ran in volume 11, issue 3, pages 228 to 230.
Five axes that separate the tools
The five axes below are the ones that move an answer, and each can be checked before an upload rather than after it. They are not equally important. The order in which a reader ranks them is the only genuine opinion in the exercise, which is why a page that hides its weights has hidden the part a reader most needs to argue with.
- Input channel. A photograph records a surface, a genotype file records named positions, and a typed sentence records the vocabulary the writer chose. Tools built for the three rarely substitute for one another.
- Output shape. One label, a ranked list, a probability per label, or a map coordinate. A single label throws away the second-place answer, which is often where the evidence sits.
- Stated label count. How many categories the tool can return, because that number sets the baseline against which every accuracy claim is measured.
- Record handling. Whether the image is stored, for how long, and whether it can be deleted without opening an account.
- Published limit. Whether the free tier caps images, days, or history. A cap on history is the one that quietly ends a comparison.
The baseline decides whether a score is good
A tool that returns one of ten labels has a ten percent chance of being right by accident. One that returns one of two hundred has half a percent. The same reported accuracy therefore means different things, and the gap is wide enough to reverse a ranking. Raw percentages let a five-label tool look stronger than a fifty-label tool doing harder work. Jacob Cohen set out the standard correction in 1960, in Educational and Psychological Measurement: subtract the agreement expected by chance, then divide by the room left above it.
There is a second baseline that lists seldom print, and it is the cost of always answering the most common label. If six of ten test photographs belong to one category, a tool that answers that category every time scores sixty percent while learning nothing. The ImageNet challenge made top-five accuracy a convention, and Olga Russakovsky and colleagues described the practice in the International Journal of Computer Vision in 2015. Top-five is informative when the label list runs to a thousand. When the list runs to five, top-five accuracy is one hundred percent by construction.
How to test one tool in an afternoon
Twenty photographs, taken in one light at one distance, with no filters and the original file kept, will separate most tools on the axes above. Label each one with a category you can defend from a published source rather than from memory, then score the answers without looking at your own labels until the end. Record a refusal as a failure, because a tool that declines has still failed to answer. Report top-one and top-three separately, and write down every label returned that was not on your list.
Twenty is a smoke test rather than a benchmark, and the arithmetic belongs beside the result. Twelve correct answers out of twenty is sixty percent, and the 95 percent confidence interval for that count runs from roughly 39 to 78 percent. That range is wide enough to swallow most of the differences a list would like to claim. If the two tools under comparison fall inside each other's interval, the honest reading is that the afternoon did not separate them, whatever the ranking page says.
What a demo page cannot tell you
Three questions do more work than any screenshot. Does the service keep the uploaded image, and for how long. Which model version answered, and when was that version trained. What is the full list of labels the model can return. A demo page answers none of them, because a demo exists to show a result rather than to describe a method. The label list is the question to insist on, since it fixes both the baseline and the ceiling, and it is the one most likely to draw a vague reply.
The list is also a commercial object, and the rules around that are not decorative. The Federal Trade Commission revised its Endorsement Guides in June 2023, printed at 88 Federal Register 48102, and defined a clear and conspicuous disclosure as one that is difficult to miss and easily understood. On an interactive medium the guidance says a disclosure should be unavoidable, and an affiliate commission counts as a material connection. A ranking with purchase links and no disclosure has described its business model by omission. This site runs its own face quiz, so it is not a neutral party either.
Where every tool still fails
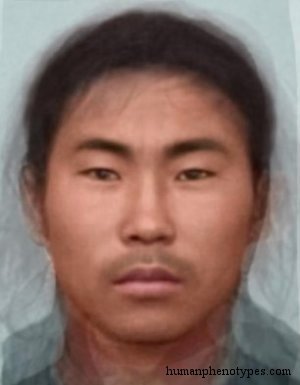
Every tool returns a token from a list. The catalogue behind this site keeps something else: a described distribution with a place and a date attached to it. Four entries show what a token leaves out. Amur-Sakhalin is recorded for the Sakhalin and Amur region and noted as present in only a few thousand people. Khoid is recorded for Nama communities, with a note that Cape Khoe and Korana groups no longer exist as described. Micronesid carries a note that only some authors treated it as a separate group. Sonorid follows the Sonora desert, an ecological belt rather than a country.
Those entries were reconstructed for roughly 1,500 years ago, and the populations they describe have since moved, mixed and been renamed. A photograph taken in a city this year sits outside the sampling frame that produced any of the records, which is why the question a tool answers is narrower than the question most people ask. A label list has no option for none of the above either, so a face from outside the training distribution still receives its nearest token at whatever confidence the model produces.
What to do with the answer
Treat the output as a hypothesis with a source attached. Write down the label, the date, the tool, and the number of labels the tool offered. Run the same photograph through a second product and compare the two label lists rather than the two answers, because a disagreement between lists is a fact about the products while a disagreement between answers is usually a fact about one photograph's lighting. Neither is a statement about a person.
The narrower question is the one with an answer. Which documented patterns do these characters fall inside, and which published sample does each pattern rest on. That question comes with citations, a date and a margin, and it survives the next model release. Keep the photograph and the note; run it again in a year, and the change in the answer will say more about the training data than the first answer said about the face.
Frequently Asked Questions
- Is there a single best AI ethnicity guesser?
- No, because best depends on a weight nobody has stated. A tool that returns forty labels is more informative than one that returns five, and also easier to score badly. A tool that keeps no image suits some readers and is useless to anyone who wants an export. Compare tools on one axis at a time, print the label count beside every accuracy figure, and treat a ranking that discloses neither as an advertisement rather than a test.
- How many labels should an ethnicity guesser return?
- Enough that the answer can be checked, and few enough that the baseline stays honest. With ten labels, chance is ten percent; with two hundred, chance is half a percent, so one score means different things at the two sizes. A longer list also raises the odds that a correct answer sits third rather than first, which is why top-three figures matter more as the list grows. Ask for the count before asking for the accuracy.
- Can an AI tool tell me my ethnicity from a photo?
- It can return a label from its own list, which is not the same claim. A photograph records a surface under one light, and these models were trained on labels collected at a particular time from a particular set of samples. Neither the training data nor the label list carries a person's ancestry, and none of it establishes identity. What a tool can do is suggest which documented appearance patterns a set of characters resembles, with the confidence and the label count stated.
Related Phenotypes
Faces from the encyclopedia that appear in this article. Open any entry for its full description, distribution, and references.
Amur-Sakhalin
Siberia
Distinctive Tungid variety, probably split from neighbouring types at the end of the Paleolithic. Native to parts of the Sakhalin-Amur regio...
Khoid
Sub-Saharan Africa
Khoisanid type, similar to Sanid, but with a slightly different morphology. Was more common in farmers and less common in hunter-gatherers c...
Micronesid
Polynesia
Northwestern Polynesid subtype. Combines Nesiotid elements with Proto Malayid and some Melanesid influence. Typically found on the islands o...
Sonorid
North America
Margid subtype, native to the hot Sonora desert of South Arizona and California, as well as Northwestern Mexico. Probably arrived with one o...
Test what you learned
Put your eye for regional faces to work in the daily quiz — a composite face, a world map, and your best guess.