Is an Ethnicity Guesser Accurate? What the Number Is Divided By
An accuracy figure for an ethnicity guesser is a fraction, and the number means nothing until you say what sits underneath the line. Four questions decide whether a published percentage is worth reading.
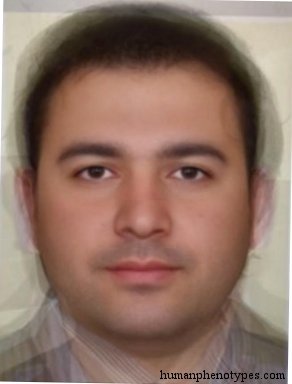
A fraction with four unknowns
A guesser that advertises seventy-two per cent accuracy has given you one number and withheld four. Accuracy is correct answers divided by attempted answers, so the figure depends on which answers were permitted, how the test photographs were gathered, who decided the true label for each one, and whether a near neighbour counted as a miss. Each of those choices has a standard name in measurement theory and each can move a result by tens of points. What follows takes them in order, because a reader deciding whether a face quiz is worth ten minutes deserves the arithmetic rather than a verdict on the quiz's character.
The chance floor under a bare percentage
Jacob Cohen set out the problem in 1960 with a psychiatric example that transfers to faces without modification. Suppose two clinicians each classify ten per cent of admissions as schizophrenic. If both assigned labels blindly at those same rates they would still agree on eighty-two per cent of cases. Cohen's kappa subtracts that expected agreement, so ninety-five per cent observed agreement against an eighty-two per cent chance floor yields 0.72, not 0.95. The same arithmetic applies to a five-label face quiz, where skewed label frequencies can push the chance floor far above one in five. Landis and Koch sorted kappa into bands in 1977, calling 0.41 to 0.60 moderate and 0.61 to 0.80 substantial, and those bands are conventions rather than thresholds with authority behind them.
What a lopsided answer set does
Give a classifier five labels where one covers forty-five per cent of the test set and it can score forty-five per cent by always answering that label and never opening the image. Nothing in the headline figure reveals this. Chicco and Jurman, comparing metrics on genomic data in BMC Genomics in 2020, found that accuracy and F1 can produce overoptimistic inflated results, especially on imbalanced datasets, and argued for the Matthews correlation coefficient instead, because it returns a high value only when all four cells of the confusion matrix are good. A model that quietly abandons a rare class cannot pass that test. For a face quiz the translation is one line: publish per-label recall beside the pooled mean.
Put numbers on it and the size of the distortion becomes obvious. Imagine a test built from five catalogue regions with frequencies of 45, 25, 15, 10 and 5 per cent. A method that answers the largest class every time scores 45 with no information at all, so a reported 52 per cent is seven points of skill and a reported 70 per cent is twenty-five. Neither statement is dishonest, but only one of them tells a reader whether the quiz is doing anything. Balanced accuracy, which averages recall across classes rather than pooling them, is the cheap correction, and it costs nothing to report alongside the raw figure.
The label set is the denominator
Closed-set accuracy assumes the correct answer is on the menu. A quiz built on 209 catalogue entries scores every photograph against those entries, so a face whose recorded pattern falls between two of them is punished twice: once when the model names the neighbour, and again when the entry it was trained to prefer turns out to be the weaker description. Open-set evaluation, where the system may answer that nothing fits, is harder to construct and almost never advertised. That asymmetry explains why a figure from a closed-set benchmark does not survive the trip to a website where anyone can upload a photograph taken in poor light at an odd angle.
Partial credit is the other half of the same problem. If a system returns a ranked list of five, counting only the top entry discards most of what it produced, while counting any hit in five inflates the score and makes the size of the label set part of the result. Neither convention is wrong, but a number without its convention is unreadable. It is why machine learning competitions usually name the metric and the evaluation protocol in the same sentence as the score, and why a page that says accurate without either is saying very little.
Where the catalogue admits its own confusions
Read the entries and the ambiguity is not concealed. East Alpinid is described as anthropometrically and morphologically very similar to European Alpinids, and the same entry concedes that the type can easily be confused with Turanid-admixed individuals. West Alpinid is the European member of the pair, a mountain type whose nucleus lies in the Western Alps and central France, so two labels share a name, a skull description and a body build while differing by a continent. North Pontid is separated from Pontids proper by wider faces, sharper features and fairer pigmentation, which is a graded difference rather than a boundary anyone could point to on a map.
A single-answer metric cannot represent that. Answering Pontid where the card says North Pontid is recorded as an error of exactly the same size as answering something from another hemisphere, and the score then measures the fineness of the grid as much as the skill of the method. The grid was drawn by nineteenth and twentieth century observers working from calipers, photographs and museum collections, which is why its neighbouring cells are neighbouring by construction. Treating the catalogue as a set of bins a classifier must hit is a reasonable engineering choice and a poor description of what the catalogue actually contains.
What a fair test would publish
None of this makes accuracy unusable. It makes accuracy incomplete, and the missing parts are clerical work rather than new experiments. A published test carrying the five items below would let a reader check the number instead of trusting the adjective in front of it, and would let someone reproduce the result after the label set has changed underneath it.
- The label set, with every entry named and a version date, so a later reader can see whether the menu moved.
- The chance floor, computed from the test set's own label frequencies rather than assumed to be one divided by the number of labels.
- Per-label recall beside pooled accuracy, since a rare entry and a common one are not the same test.
- The abstention rate in an open-set condition, reported separately from outright errors.
- Who assigned the true labels, whether one coder, several coders or self-report, with the disagreement rate when there was more than one.
Where the fifteen-hundred-year map stops
Every entry in the catalogue describes a historical sample, recorded as a baseline roughly fifteen hundred years ago. Movement since then rearranged the map repeatedly: plantation economies, industrial cities, the displacements of the twentieth century and seventy years of long-distance migration all placed people far from the regions where their grandparents' appearance patterns were documented. A quiz that returns a historical type is answering a question about that older map, which is a legitimate thing to be curious about. It is not naming the person in the photograph, and no accuracy figure, however carefully computed, converts one into the other.
This site runs its own quiz and sits inside the same limit, which is why the catalogue pages read as descriptions of recorded patterns rather than as tests of identity. A percentage can tell you how often a method matches a card. It cannot tell you what the person in front of you is, because the card was never built to answer that.
Frequently Asked Questions
- Is an ethnicity guesser accurate?
- It depends what the percentage is measured against. Seventy per cent means something very different when the chance floor is twenty per cent than when it is forty-five, and something different again when the label set excluded the correct answer. Ask for the label set, the chance floor, per-label recall and the abstention rate. Without those four items the number is a marketing claim rather than a measurement, and the same test can be made to look strong or weak by changing which photographs are in it.
- What kappa counts as good for a face classifier?
- There is no universal threshold. Landis and Koch proposed bands in 1977 in which 0.41 to 0.60 counts as moderate and 0.61 to 0.80 as substantial, but those were conventions for observer agreement studies rather than standards for machine classification. What matters more is the comparison being made: kappa against a majority-class baseline, and kappa on a test set whose label frequencies resemble the setting where the tool will actually be used. A kappa from a balanced laboratory set says little about a website whose uploads are not balanced.
- Why does this site not publish an accuracy score?
- Because the catalogue describes recorded historical patterns rather than predicting living people, and a single number would imply a precision the underlying sources do not support. Those sources are nineteenth and twentieth century anthropometric descriptions with their own sampling problems. Where an entry is uncertain it says so, and where two types overlap the entries admit it. A quiz score would compress all of that into one figure that flatters the method and misleads the reader about what the catalogue is for.
Related Phenotypes
Faces from the encyclopedia that appear in this article. Open any entry for its full description, distribution, and references.
East Alpinid
Middle East
West Asian type that is anthropometrically and morphologically very similar to European Alpinids. Most common in the mountain zones of Anato...
West Alpinid
Central Europe
Alpinid proper, historically found in the mountain regions of Western Europe. Often a cohabitant of a second mountain type, the Dinarid. The...
North Pontid
Northern Europe
Altered Mediterranoid of Eastern Europe that connects Pontids with more northern types. Most common in a large area from Poland to the Russi...
Pontid
Southern Europe
East Mediterranid type, sometimes associated with ancient Scythians, Kurgans, and other steppe peoples. Common in the Balkans, especially Bu...
Test what you learned
Put your eye for regional faces to work in the daily quiz — a composite face, a world map, and your best guess.