Phenotype in Anthropology: The Unit It Was Borrowed To Replace
Anthropology took the word phenotype from a 1909 bean experiment and used it to replace an older unit, the type specimen, with a distribution of measurements.
The word arrived from a bean experiment
Wilhelm Johannsen coined both genotype and phenotype in 1909, in Elemente der exakten Erblichkeitslehre, a textbook built on his experiments with garden beans. He needed the pair because his pure lines refused to behave: plants of identical parentage still differed in seed weight depending on where a seed had sat on the mother plant. One word named the heritable constitution, the other named what could be seen and measured. The distinction was a guard against a specific error, that of reading a measurement as a cause. Anthropology adopted phenotype within two decades, but it adopted the word into a field that had already spent fifty years measuring bodies without it, and with a different unit already in place.
Anthropology already had a unit
William Z. Ripley published The Races of Europe in 1899 with three divisions for the continent, built almost entirely from three variables: cephalic index, stature, and pigmentation. Joseph Deniker's 1900 classification, in the version usually cited, ran to six principal divisions and twenty-nine sub-races. Neither author worked from averages. The unit of analysis was a type specimen, a modal individual whose combination of traits could be pointed at in a photograph or in a measuring session. That unit left marks on naming. The Hallstatt entry in this catalogue carries a label taken from a village in Upper Austria, where an Iron Age cemetery supplied the reference remains; Coon repeated the name in 1939 and Eickstedt still used it in 1952. A type named after a burial ground is a description anchored to a place and a date, not to a population.
Measurement turned the type into a number
Rudolf Martin's Lehrbuch der Anthropologie, first published in 1914, did more than any single book to make bodies comparable across laboratories. It fixed the landmarks, including the Frankfort plane for the skull, specified the instruments, and reduced each observation to a figure that another worker could reproduce. The cephalic index is the clearest product of that programme: maximum skull breadth divided by maximum length, multiplied by one hundred. Below 75 was dolichocephalic, 75 to 80 mesocephalic, above 80 brachycephalic. Once a type could be computed from three numbers, types multiplied, and the names started to record the arithmetic.
Central Brachid shows the pattern in miniature. Giuffrida-Ruggeri described the form in 1912 as Homo indicus brachimorphus, a name that states the measurement outright. Eickstedt renamed it Central Brachid in 1937 and placed it in the Doab, the tongue of land between the Ganges and the Yamuna; the entry now runs from Uttar Pradesh across the Gangetic plain to the Deccan. By then the label carried two things at once, a position on an index scale and a coordinate on a map. The trait list still opens with a brachycephalic, hypsicranic vault, before it says anything about skin or hair.
Boas measured the children of immigrants
In 1912 Franz Boas reported on the head form of immigrants and their American-born children, and the numbers did not hold still. Children born in New York differed from their parents in cephalic index by amounts too large to be explained by instrument error alone. If a skull measure moves within one generation, a type cannot be a fixed unit, and the word phenotype begins to do real work: the visible form is a response to conditions, not a badge of descent. The finding has been fought over ever since. Sparks and Jantz, reanalysing the original data in 2002, found the effect smaller than reported; Gravlee, Bernard and Leonard argued in 2003 that the conclusion survives. The dispute is about magnitude now, not about whether the plasticity exists.
Washburn made the population the unit
Sherwood Washburn's 1951 paper The New Physical Anthropology is usually treated as the break point. The object of study stopped being a type and became a population described by frequencies. Livingstone pushed the logic further in 1962 with On the Non-Existence of Human Races: any trait followed across a continent changes gradually, and the boundaries you can draw depend on which trait you chose to follow. Lewontin's 1972 apportionment put a number on the consequence, with 85.4 percent of human genetic variation falling inside populations rather than between them. After that a catalogue of types could still be compiled, but it could no longer be presented as a map of kinds.
W. W. Howells showed what the replacement looked like in practice. Cranial Variation in Man in 1973, and Skull Shapes and the Map in 1989, measured 2,524 skulls from 28 populations and reported the result as a matrix of Mahalanobis distances rather than a list of types. A matrix can be clustered, tested, and re-run against new samples. A type can only be illustrated. The catalogue on this site keeps the older format deliberately, because the older format is what the historical literature actually contains.
What the 209 entries actually are
Each entry preserves the form the literature used: a name, a region, a list of observable traits, and a trail of references. The names are the least portable part and the most informative. North Pontid was named by Viktor Bunak in 1932 for a belt running from Poland to Penza; Satsuma was named by Erwin Baelz in 1883 after a region of Kagoshima. Neither name describes a mechanism. Both record where a description was assembled.
- A name and its author, with the year the label was introduced, so a 1883 coinage can be told apart from a 1937 revision.
- A region stated as a distribution rather than a border, including the sub-varieties the original author separated out.
- A trait list in the vocabulary of the period: index values, hair form, nasal profile, limb proportions.
- References, because an entry without a citation is a rumour with a map attached to it.
Where the map stops matching
The descriptions rest on samples collected mostly between 1880 and 1960, and they describe a world that has moved since. The baseline this catalogue states is roughly 1500 years ago, before the Atlantic trade, before industrial labour migration, before the displacements of the twentieth century. Several entries were already recording mixed populations when they were written. The Gangetic plain and the Congo forest were not closed basins in 1930, and the authors knew it, which is why so many types are defined as intermediates between two neighbours rather than as centres.
The word has moved again since. In genomics a phenotype is any measured variable, from a blood lipid to a hippocampal volume, and phenomics now means the systematic collection of such variables at scale; the UK Biobank alone holds about half a million participants. This catalogue uses the older, narrower sense, a describable appearance pattern with a documented historical distribution. Saying which sense is meant is not pedantry. It separates an entry that can be checked against a 1932 paper from a label that claims to know something about whoever is standing in front of a camera.
Frequently Asked Questions
- Who coined the word phenotype, and when did anthropology start using it?
- Wilhelm Johannsen coined phenotype and genotype in 1909 to separate a plant's heritable constitution from its measurable appearance. Physical anthropology took the term up over the following two decades, but the discipline's working unit stayed the type specimen until the 1950s, when Washburn and others argued for populations described by trait frequencies. The word arrived first and the change of unit followed, which is why catalogue entries written in the 1930s still read like descriptions of a single model individual.
- Is a phenotype the same thing as a race?
- No. A phenotype is an observable trait or set of traits, measured on individuals or summarised for a sample. Race is a classification scheme imposed on top of such traits, and the scheme does not survive contact with the data: Lewontin's 1972 apportionment put roughly 85 percent of human genetic variation inside populations rather than between them, and Livingstone argued in 1962 that trait frequencies change gradually across space. A catalogue can record appearance patterns without treating them as kinds of people, and that is the distinction the entries here try to hold.
- Why do the entry names sound like place names?
- Because many of them are. Hallstatt is a village in Upper Austria, Satsuma is a region of Kagoshima, and Central Brachid takes its second half from the Doab. Nineteenth and early twentieth century anthropologists named types after the site where reference remains were excavated, the province a sample came from, or the index value that defined the form. The name is a record of provenance, which makes it useful for tracing a claim back to its source and useless as a description of anyone alive today.
Related Phenotypes
Faces from the encyclopedia that appear in this article. Open any entry for its full description, distribution, and references.
Hallstatt
Central Europe
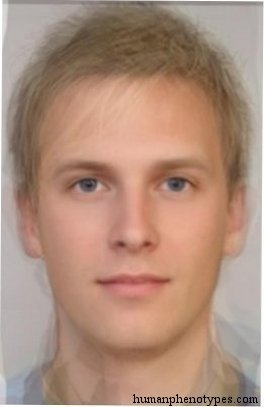
Nordid proper, resembles the Iron Age remains of the Austrian village of Hallstatt. Most common among Swedes and South Norwegians. Frequent ...
Central Brachid
Central Europe
Indo Brachid variety, with a morphological and geographical position between West and East (Indo) Brachids, but possibly resulting from diff...
North Pontid
Northern Europe
Altered Mediterranoid of Eastern Europe that connects Pontids with more northern types. Most common in a large area from Poland to the Russi...
Satsuma
East Asia
South Mongolid type of Japan and Korea, somewhat influenced by Tungid. Named after the Satsuma region of Kagoshima. Today the most populous ...
Test what you learned
Put your eye for regional faces to work in the daily quiz — a composite face, a world map, and your best guess.