What Race Do I Look Like: Whose Body Was Measured
Every answer to this question describes a sample of people, and the catalogue never says which one: of 209 entries, 26 mention sex and none records an age.
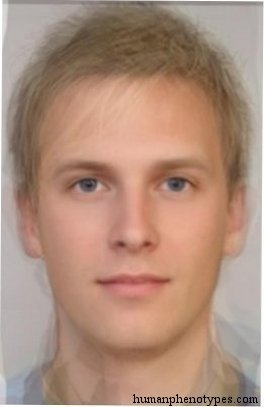
The answer describes a sample, not a face
The question asks for a category, and a category has to be populated by somebody. Every entry in this catalogue is a summary of people who were measured, photographed or described at a particular time and place, which means each entry carries the properties of the group it came from: how many of them were men, how old they were, and which decade the observation belongs to. Those three properties decide what a described band of traits actually describes, and the record drops all three between the measurement and the entry.
The numbers are blunt. Of the 209 entries, twenty-six mention sex at all, and every one of those mentions qualifies a single trait rather than stating who the sample was: a chin more pronounced in women, a nose lower in women, hips wide even in women. Six entries mention age, and five of those are notes about the body in old age, skin wrinkling or weight settling. None of the 209 entries states how old the people described were. Nobody in the catalogue is recorded as thirty, or as an adult, or as a man of a stated age.
Upstream, the series were split by sex
The omission belongs to the format, not to the evidence, and the craniometric literature shows why. William Howells, working from the late 1960s, selected roughly fifty to fifty-five skulls of each sex for each population he measured, which means the series behind his published comparisons were separated by sex from the start. Where the sex of a cranium was unknown, which was common in skeletal collections, he assigned it by examining the sexually dimorphic features: supraorbital ridges, upper orbital margins, zygomatic arches, and the base and nuchal area.
That detail is worth sitting with, because it makes a circle. The features used to sort a skull into male or female are the same class of feature the entries describe. Sex was not read off a document in a museum drawer; it was inferred from bone, by an observer, and then it was used to split the sample. Downstream in the catalogue, the split disappears and only the pooled description survives. The information was collected, used, and then discarded by the format that inherited it.
Where a number had to be sexed, it was
The record proves it can carry the information whenever the alternative would be absurd. Two entries give a stature in centimetres rather than as an adjective, and both attach the word males to the figure: one records a very short variety at 140 to 145 cm in males, the other 147 cm in males. Faced with a number that would be misleading if pooled, the format states whose number it is.
Everywhere else the description grades a quotient. Head breadth against head length, nasal breadth against nasal height, sitting height against standing height: these are ratios, and a ratio can be identical for two bodies of very different size. If the band was computed on a pooled sample it blends two different means, and if it was computed on one sex the entry does not say which. Either way the reader receives a figure whose denominator is missing, and the question of what race a face looks like is being answered with that figure.
The difference underneath is not small
How much the missing variable matters is measurable, if not for these bands then for the structures they sit on. A 2014 meta-analysis by Ruigrok and colleagues pooled 77 studies and close to 15,000 participants and found intracranial volume about 12 per cent larger in males, with an effect size of 3.0, and total brain volume 10.8 per cent larger. A UK Biobank study by Ritchie and colleagues in 2018, on 5,216 participants, put the total brain volume difference at 10.6 per cent. The same review notes that adult men average roughly nine per cent taller and eighteen per cent heavier than adult women.
A ratio cancels part of a size difference, which is exactly why the omission is easy to miss and hard to forgive. Dividing breadth by length removes some of the scale, so the resulting index moves less between the sexes than the raw measurements do. How much less, trait by trait, is a number the entry does not carry and the reader cannot recover. The band is therefore not wrong. It is under-specified, and the specification it lacks is the one that would let a reader decide whether a face of their own size should be compared to it at all.
Age is treated as a cosmetic note
Age fares worse than sex, because it is not treated as a variable at all. The five mentions of old age in the catalogue are observations about surfaces: skin wrinkled in old age, a build turning heavier in old age. They describe what age does to the appearance being catalogued, not who was catalogued, and no entry records the age range of the people behind its description. A band of adult traits is presented as though adulthood were a single condition.
It is not, and the trajectory differs by sex. A longitudinal imaging study by Lenroot and colleagues, published in NeuroImage in 2007, followed 387 subjects from age three to twenty-seven across 829 scans and found total cerebral volume peaking at about 10.5 years in females and 14.5 in males, with cortical grey matter peaking one to two years earlier in females. The organ whose proportions set the ratios in the catalogue reaches its own maximum at a different age depending on sex, and the entry carries neither figure. Someone asking the question at fourteen and the same person asking at forty are being compared to a reference that does not distinguish between them.
The quotient moved while the entry stayed
The catalogue is candid about change when change is what it is describing. Neo-Danubian records that the type became more populous over recent centuries, increasing brachycephaly in Russia, which is a statement that a graded index shifted within a few hundred years in a defined region. Robust Polynesid notes that its range covers the area where the cephalic index peaks. African Alpinoid records close morphological similarity to Alpine types while noting that the resemblance probably does not come from shared descent but from a similar adaptation.
Three sentences, three admissions that a description is dated. The last one matters most for the question: resemblance and relatedness are separate claims, and a person can share the visible pattern of a group without sharing its history. Add the movement that came after the baseline, when the Atlantic trade, nineteenth-century labour migration and the last century of global relocation rearranged the populations these entries describe, and the reference stops being a picture of anywhere in particular. It remains a dated record of what an observer saw, which is a smaller and more durable claim than the one the question makes.
What the sentence can return
The answerable form of the question names its denominator: which described pattern these features fall inside, which traits were graded, in which decade, on a sample of whom. Hallstatt can be answered that way, since the entry names an Iron Age cemetery in Austria, reports the pattern as most common among Swedes and southern Norwegians, and records a build with wide shoulders and narrow hips even in women, which is at least a statement about sex attached to a trait. Central Pamirid shows the other edge of the same problem: it is described as showing intermediate features between the Plains Pamirid and the East Pamirid, and as often considered the most typical Turanid, so the entry's own position is a judgement about a set of other entries.
That is what a catalogue can offer, and it is not a mirror. A face supplies weak evidence about a distribution and none about an identity, and the missing sex and age are not a scandal to be corrected so much as a boundary of the format. The honest version of the question is comparative and dated: compare these traits to this record, measured on these people, in this decade, and hold the result loosely. Anything stronger requires a denominator the record never had.
Frequently Asked Questions
- Why does the sex of the measured sample matter for a description of appearance?
- Because many of the traits are graded as ratios, and the raw measurements behind them differ by sex. Intracranial volume is about 12 per cent larger in males in a 2014 meta-analysis of 77 studies, and adult men average roughly nine per cent taller. Dividing one measurement by another cancels part of that difference without cancelling all of it, so a pooled band and a single-sex band are not the same object, even when both are printed the same way.
- Does the catalogue really never state the age of the people described?
- No entry records an age range for its sample. Six of the 209 entries mention age at all, and five of those are notes about the body in old age, such as skin wrinkling or a heavier build. That is a description of how age affects appearance, not a statement about who was measured. The studies behind the entries used adult material, but the entry itself does not carry that qualifier forward to the reader.
- If resemblance is not relatedness, what is a phenotype entry actually for?
- It records that an observer, in a named year, described a set of visible features as occurring across a region, and it lists the works that say so. That makes it checkable, datable and arguable, which a label produced from a photograph is not. African Alpinoid is a good example of the limit: the record notes a close resemblance to Alpine types and states that the similarity probably comes from adaptation rather than common descent.
Related Phenotypes
Faces from the encyclopedia that appear in this article. Open any entry for its full description, distribution, and references.
Hallstatt
Central Europe
Nordid proper, resembles the Iron Age remains of the Austrian village of Hallstatt. Most common among Swedes and South Norwegians. Frequent ...
Central Pamirid
Central Asia
The most typical Pamirid variety, also called Mountain Pamirid. Often considered the most typical Turanid. Most common in highland Tajiks, w...
African Alpinoid
North Africa
The most brachycephalic Maghrebi type, shows close morphological similarities to Alpines and in a lower degree to Armenids and Berberids. Pr...
Neo Danubian
Eastern Europe
East Europid variety with Nordic and Ladogan elements, associated with Slavs. Became more populous during the last centuries, increasing bra...
Test what you learned
Put your eye for regional faces to work in the daily quiz — a composite face, a world map, and your best guess.